Statistics Terms
Interaction Effects
313246a and hunsbeja
Analogy
Imagine you’re baking a cake, and you want to know how two different factors affect its moisture: the type of flour used (factor A) and the type of sweetener used (factor B).
Factor A represents the type of flour: regular flour vs. gluten-free flour. Factor B represents the type of sweetener: sugar vs. honey.
Now, you decide to bake four cakes, each with a different combination of flour and sweetener:
- Cake A: Regular flour + Sugar
- Cake B: Regular flour + Honey
- Cake C: Gluten-free flour + Sugar
- Cake D: Gluten-free flour + Honey
After baking each cake, you evaluate how moist each cake is. You find that the varying types of flour and type of sweetener produce different results. Cake A and Cake D result in moist cakes; while Cake B and C produce dry cakes.
We see that they type of flower and type of sweetener result in different products when used in conjunction with each other. This is called an interaction effect in the statistical world.
Diagram
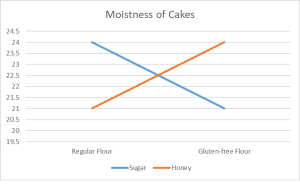
The figure above demonstrates what happens when a moisture meter is placed into the four cakes. As we can see, cakes that use regular flour and sugar and gluten-free flour and honey result in more moist cakes.
Example
Let’s consider a hypothetical study examining the effects of two factors, caffeine intake (low vs. high) and exercise (sedentary vs. active), on participants’ reaction times in a cognitive task.
To do so, we have collected eight points of data
| Participant | Caffeine Intake | Exercise | Reaction Time in seconds |
| 1 | Low | Sedentary | 300 |
| 2 | High | Sedentary | 320 |
| 3 | Low | Active | 280 |
| 4 | High | Active | 260 |
| 5 | Low | Sedentary | 310 |
| 6 | High | Active | 250 |
| 7 | Low | Active | 290 |
| 8 | High | Sedentary | 330 |
We then calculate the mean and standard deviation for all identified groups.
| Condition | Mean Reaction Time | SD Reaction Time |
| LxS | 305 | 5 |
| HxS | 325 | 5 |
| LxA | 285 | 5 |
| HxA | 255 | 5 |
Once we’ve obtained the means for each group, we can calculate the means for each level of each factor (exercise and caffeine intake)
| Caffeine Intake | ||||
| Low | High | Average | ||
| Exercise | Sedentary | 305 | 325 | 315 |
| Active | 285 | 255 | 270 | |
| Average | 295 | 290 |
We can then calculate the Sums of Squares for the interaction (SSAB) to calculate Means Squared for the interaction (MSAB). We then divide MSAB by MSW (within) to calculate our F-statistic.
SSAB = 3935.25
dfAB = (2-1)(2-1) = 1
MSAB = 3935.25/1
MSW = 14.8
F = 265.90
Plain Language Definition
An interaction effect is when multiple controlled variables differentially impact the outcome variable.
Technical Definition
Interaction effect is present when the simple effects of one IV are not the same at all levels of the other IV.
Media Attributions
- Untitled
