Statistics Terms
Interactions
laycocla
Analogy
Imagine you are driving your vehicle down a deserted road, and a police officer pulls up behind you. What is the chance you’ll get a speeding ticket? If we add in another condition, say weather, does that impact that chance? Maybe we are comparing speeds of 10 mph slower, precisely the speed limit, 10 mph faster, and 25 mph faster than the speed limit in two conditions: clear, sunny day and a day with heavy rain and low visibility. You might rightfully think that the chance of getting pulled over by the police officer will vary not only based on your speed, but also based on the driving conditions. An officer may be tolerant of you going 10 mph faster than the speed limit on a clear sunny day but far less tolerant of you going 10 mph faster than the speed limit in dangerous driving conditions. This is like an interaction, where the effect of one variable (speed) varies at different levels of the other variable (driving conditions).
Diagram

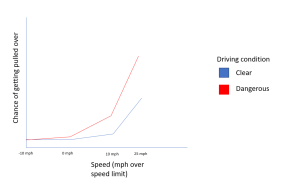
This diagram shows two different driving conditions – clear and dangerous, and four different speeds (below, at, over, and very over the speed limit), and how they relate to a person’s chance of getting pulled over. You can see that the driving condition interacts with speed, because for each driving condition, there is a different chance of getting pulled over at different speeds – it varies at different levels of speed.
Example
An example of an interaction can be seen in the following set-up: you are trying to improve students’ data analysis abilities. You’ve decided that you’re going to set up an experiment, and some sections will get an integrated intervention, some sections will get a single lesson, and other sections will get nothing. You also gather student data, namely year in college. What you find is that while both interventions are better than nothing, they are much more effective for third years than they are first year students. The effectiveness of the intervention varies based on the year of school the students are in.
Plain Language Definition
An interaction happens when the effect of a variable on what is being measured changes at different levels of another variable.
Technical Definition
An interaction is when the effect of one independent variable on the outcome (DV) differs depending on the level of another independent variable. In other words, the relationship between the independent variable and the outcome is not consistent across different levels of the other independent variable.
Media Attributions
- adept_2_diagram

