1 Digital Imaging
What is a digital image?
Digital cameras and other light detectors, convert light intensities to electrical currents, which are then converted by a computer to numbers. Digital images are square or rectangular arrays of pixels (pix-el = “picture elements”), with each pixel containing a number that expresses the light intensity at that location in the image. Pixels in monochrome (“black and white” or “grayscale”) images only have one number each (Fig. 1), while pixels in color images have three, representing the levels of red, green, and blue light. When you open a digital image, the computer takes these numbers and translates them into the intensities/colors you see on the computer screen (Fig. 1).

What does a pixel’s value really mean?
The numbers that comprise digital images are integers and are in “relative” units, meaning that the intensities are not measured on an absolute scale (e.g. lumen, lux). The practical implication of this is that you cannot directly compare intensities or colors between different images. For example, if you see two images of cells with identical intensities, you cannot be certain that the two cells actually had similar intensities in real life. The same is true for color images: you cannot be certain that the same shades of a color in two different images are actually similar in the original specimens. This is somewhat analogous to saying, if you got an A in organic chemistry and an A in a 1-credit elective sports class, it does not necessarily mean you worked equally as hard in both classes to obtain those grades. Qualitative comparisons between intensities or colors in different images requires controls and consistency in sample preparation and image acquisition. Quantitative comparisons of intensities–even within the same image–are even more difficult and require even more extensive controls and protocol consistency.

Pixel values are constrained by lower and upper limits. The lowest possible value is 0, which is commonly represented as black. The highest possible value depends on the bit-depth of the image format. A bit-depth of 2 means that there are 22 =4 “gray levels” and their intensity values range from 0 to 3 (one less than 4 because 0 is counted as a value, Fig. 2). The smallest typical bit-depth for images is 8-bit, which has 256 possible pixel values (0 to 255). Color images are a combination of three 8-bit images for red, green, and blue intensities (e.g. a pixel with the values 255,0,0 displays as red; 255,255,255 is white). Nearly all images you see in real life are color images but, depending on the microscopy technique you’re using, you may acquire a monochrome image instead. Scientific cameras can acquire 12-bit (4,096 values) and 16-bit (65,536 values) monochrome images. Higher bit-depth images do not enable you to image brighter intensities; rather, they give you greater precision (Fig. 2). It is analogous to measuring your height in centimeters versus meters: I am 170 cm tall, but if we were measuring in meters only (you can only be 0, 1, 2, 3 etc. meters) I would be 2 m tall, which is clearly not as precise. Incidentally, our eyes can’t detect more than ~26 = 64 shades of gray, which is why the 8-bit and 12-bit gradients in Fig. 2 look identical.
Practical Implications for Digital Imaging
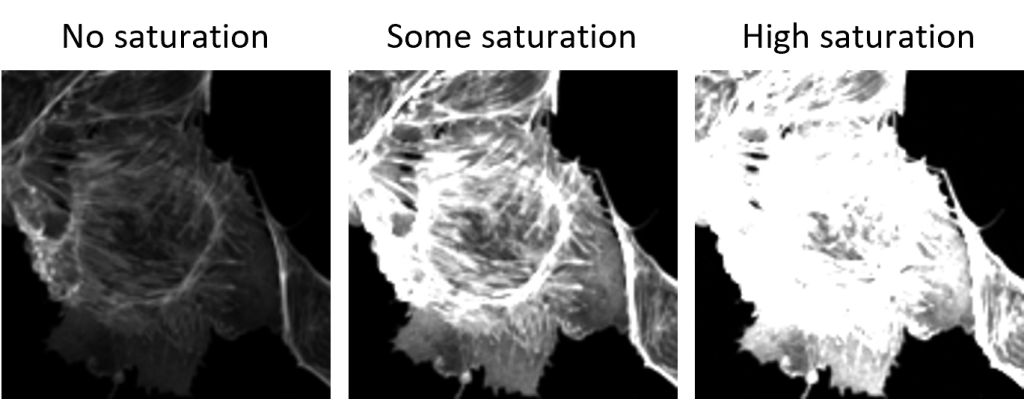
One consequence of there being an upper limit to intensity values is that, if your specimen is too bright, the camera will be unable to record accurate intensity values. All intensities above the upper limit, will simply be displayed as the highest possible value (e.g. 255 for an 8-bit image), regardless of whether that number accurately describes the intensity. This phenomenon is called saturation (also called clipping or over-exposure) and it causes bright regions of images to lose their detail and appear “whited-out” (Fig. 3). Saturation is analogous to trying to measure the height of a group of adults using a meter-stick. Because the meter-stick isn’t tall enough to reach the adults’ full height, every adult will be measured as one meter tall. The solution is to change your illumination or acquisition settings to decrease the overall intensity of the specimen so that it fits within the range of the camera.
On the other hand, you want your image sufficiently bright that 1) you can see it, and 2) you are maximizing use of the full range of your bit-depth. It doesn’t make sense to use only a small portion of the shades of gray available to you. Therefore, in general, you want your image to be as bright as possible without saturating. This is usually not difficult to do using transmitted light techniques, but can be complicated if you are performing fluorescence microscopy. During your training, you will learn how to adjust your illumination and acquisition parameters to utilize the full range of intensity values available.
A Note about Color
If you are taking color images…
Color cameras “see” color differently that we do and therefore may acquire images where the color is “off” (e.g. everything has a red tint). This can be fixed by calibrating the camera using a procedure known as color balancing or white balancing. You will learn how to do this during your training. If you are taking fluorescence images, you are using a monochrome camera and not a color camera (see the next section).
If you are taking monochrome images (includes fluorescence)…
We often think of monochrome as “black and white” but the computer can assign any color to a given pixel value. For example, monochrome images can be displayed in shades of red or green or even a rainbow of colors. Therefore, if you see a monochrome image displayed in color, realize that the color is fake. This doesn’t, however, mean that it’s bad to color monochrome images–it can sometimes help you visualize your data. You will learn how to change the (fake) coloration of monochrome images during your training.
