5 Chapter 5: Closing the Loop – Using Models with Decision Makers
Closing the Loop: Using Models with Decision Makers
“What a useful thing a pocket-map is!” I remarked.
“That’s another thing we’ve learned from your Nation,” said Mein Herr, “map-making. But we’ve carried it much further than you. What do you consider the largest map that would be really useful?”
“About six inches to the mile.”
“Only six inches!” exclaimed Mein Herr. “We very soon got to six yards to the mile. Then we tried a hundred yards to the mile. And then came the grandest idea of all! We actually made a map of the country, on the scale of a mile to the mile!”
“Have you used it much?” I enquired.
“It has never been spread out, yet,” said Mein Herr: “the farmers objected: they said it would cover the whole country, and shut out the sunlight! So we now use the country itself, as its own map, and I assure you it does nearly as well.”
Lewis Carroll (1893). Sylvie and Bruno Concluded.
People use maps to help them find their way around an area. Nowadays, these maps are often digital and are accessed over your smartphone or some other GPS device. Whether in paper or digital form, the beauty of maps is that they are incredibly small ― compact enough to fit in the palm of your hand.
This smallness means that maps can’t show you every detail of the real world; they offer a simplified view of reality. If a mapmaker tried to show every detail, their map would be like the one described by Mein Herr in the quote at the top of this section. Such a map would be useless! One might as well just drive around the countryside and use trial and error to find their way around.
We use maps precisely because they are simplified representations of the real geographic landscape. By leaving out unimportant details, we can concentrate on those features that are most needed to help us find our way around. Instead of showing every garden, tree, flower, or trash can, a good map shows us roads, distances, directions, and so on. What they leave out is not needed to serve the map’s purpose.
A system dynamics simulation model is a lot like a map.
- Like a map, a system dynamics simulator is designed to help someone solve a problem. But the problem isn’t a navigational problem like “How can I get to the airport?” Instead, a system dynamics model addresses problems like: “How did we get into this mess, and how can we effectively work now to get the future we most desire?”
- Like a map, a system dynamics model describes and mimics an underlying reality. In the case of a map that reality is some geographic region of interest. In the case of a system dynamics model, the reality is the structure at the root of the problem.
- Like a map, a system dynamics model employs a certain language and symbolism. Maps use dots for towns, lines for roads, and so on. System dynamics simulators use stocks, flows, causal links, feedback loops, behavior over time graphs, and simulation.
- Like a map, a system dynamics model simplifies reality. Otherwise, the simulator would be so complicated as to be useless to us. The way a system dynamics modeler achieves a useful level of simplicity is to avoid modeling a system per se, but instead to model only those parts of a system that are relevant to the problem of interest. That is, the system is merely our way of conceptualizing the roots of the problem. Without focusing on a particular problem, we’d have no rational basis for drawing a boundary around our model (Richardson and Pugh, 1981). Everything in the world would be included. By modeling a problem, we have a basis for deciding what to include and (just as importantly) what to exclude (Forrester, 1961).
- Both a map and a system dynamics model are designed with particular users in mind. In the case of a map, the users might be tourists or hikers who wish to explore a part of the Swiss Alps. In the case of a system simulator, we refer to the user as the decision maker. This refers to a person (or group) who is responsible and capable of responding to the problem with policies that are aimed at influencing the future in desirable ways.
5.1. Four-Stage Process for Using Models with Decision Makers
Working with a decision maker to build and use a system dynamics model is one of the most important contexts in which system dynamics modeling is done (Sterman, 2000; Vennix, 1996). Over the years, researchers and practitioners have developed an approach to doing this (Rouwette, et al., 2011; Richardson and Andersen, 1995). Figure 34 outlines four stages of a project to keep in mind when working with a decision maker. Under each stage is listed a set of outcomes or deliverables that are typically produced at that stage. This formulation is not exhaustive, but it is provided here as a rough guide at this introductory stage of modeling. You should also be aware that the modeling process is iterative. You will learn, start to ask better questions, and adjust your focus and this will require that you go back and refine earlier work. Many of the elements in this process have been discussed already. We provide here a brief description of each element in order to place it in the larger context of the process.
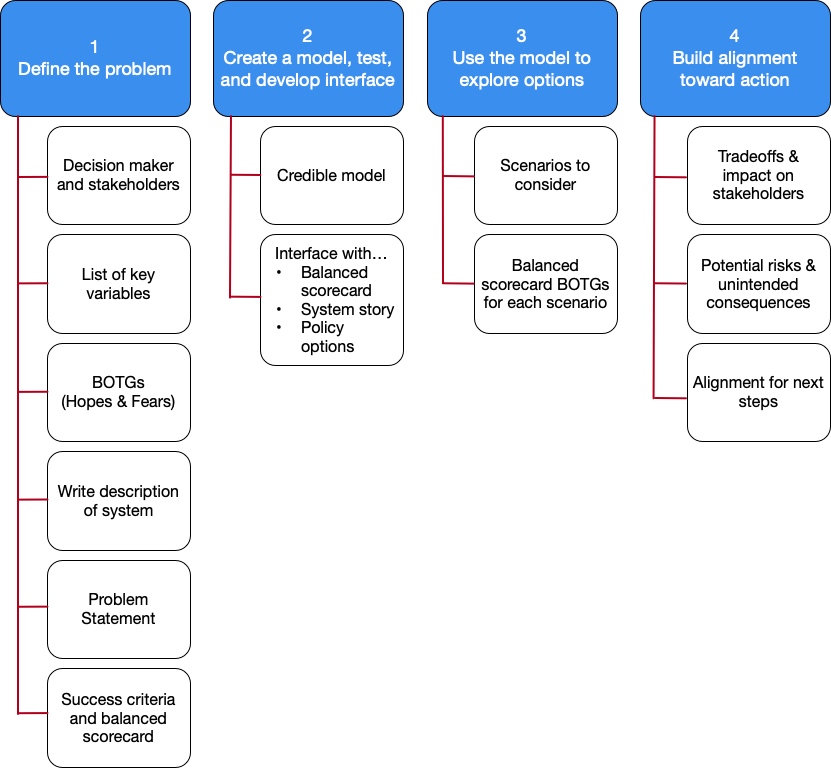
Stage 1: Define the Problem
 Here the purpose is to apply a system-based view to identify and describe the problem to be addressed. Doing so will help clarify the purpose and scope of our modeling effort and the criteria for gauging how successful are the decision maker’s efforts to address the problem. If done properly, this step helps direct the modeling effort so that we have an appropriate level of sophistication and completeness to the model, while avoiding the pitfall of trying to “model the system” instead of “modeling the problem.”
It is critical to involve the decision maker and stakeholders from the beginning. Without their involvement, you may end up solving the wrong problem, or your model may fail to examine the tradeoffs that come with each policy that is considered. Failing to involve these players at the very beginning is a recipe for disaster.
Decision Makers and Stakeholders
As mentioned earlier, the decision maker (or client) is that individual or group that has responsibility for identifying and implementing policies to address the problem and to pursue desirable outcomes for the future. But the decision maker cannot act unilaterally. Their actions will impact others and they may even be dependent on others to implement whatever policies they choose. Hence, in addition to the decision maker, you must also engage the important stakeholders at the very beginning. These are individuals or groups who are affected by the problem and who may also be important actors who could also impact the future.
In the Kaibab Challenge at the beginning of this Learning Guide, you and your team played the role of decision makers. You were responsible for making decisions to impact the future of the Kaibab and the mule deer population. Your efforts were evaluated by important stakeholders who themselves played important roles. Your boss and President Roosevelt wanted to see the mule deer population flourish. They provided you with the resources to implement those policies you identified. The local ranchers wanted to use the Kaibab for pasture and to see the predators eliminated. Their cooperation was critical. The local hunters wanted to use the Kaibab for hunting of both deer and predators.
List of Key Variables
Engage with Decision-Makers and Stakeholders: Start by having discussions with decision-makers and key stakeholders. During these discussions, aim to create a comprehensive list of key variables that are relevant to the problem or scenario you are addressing.
Measurability: The key variables you identify should be measurable. This means that they should have a clear sense of increasing or decreasing over time. Some of these variables will have units with numerical meanings that can easily convey changes. For example, if the number of mule deer in the Kaibab increased from 4,000 to 8,000, it’s evident that the population has doubled, and people can understand this change.
Tangible and Intangible Variables: While some variables have tangible, quantifiable measurements, others may be more abstract but equally crucial. For instance, faculty morale falling by 50 percent in your department may not have a direct numerical measurement, but it still has a clear sense of going down. Such intangible variables, if relevant to the problem at hand, should be considered for inclusion in the model.
Brainstorming Session: This initial phase is like a brainstorming session where the goal is to generate as many potential key variables as possible. Be open to various ideas and inputs from stakeholders. Don’t worry too much about whether they are quantifiable at this stage.
Evolution of the List: As you progress in your modeling journey and gather more information, some variables may become more important, while others may no longer seem relevant. Your list of key variables may evolve over time, and it’s normal to add or remove variables as your understanding of the problem deepens.
Use in Models and Scorecards: The list of key variables you generate will serve as a foundation for building your models. These variables will be used to create behavior over time graphs and may also be part of your balanced scorecard, which helps measure and track performance in various aspects of the problem or project.
In summary, the process begins with collaboration and brainstorming to identify a wide range of key variables, both measurable and intangible, that are relevant to your modeling or analysis. As your work progresses, refine and adapt this list based on the changing needs of your project.
Behavior Over Time Graphs (BOTGs)
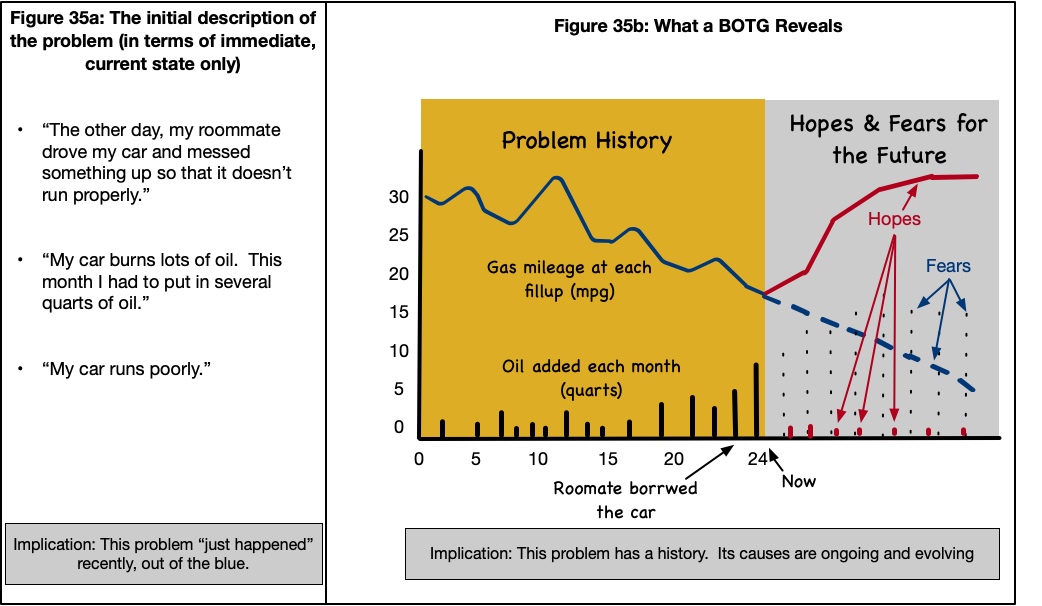
BOTG graphs show historical trends that represent the status of the problem over time. These trends should become the locus of concern for your client. To be sure, your client may not at first describe the problem in terms of an historical and future time trend. Instead they may focus on the current state of affairs or some goal that they want to achieve.
For example, recall that in an earlier section we describe an imaginary situation in which your friend described a problem with their car using the three statements in Figure 31a. Taken together, these three statements describe the current state of affairs and offer no historical or longer-term perspective. They also imply the cause and blame for the problem. This description implies that the problem is a short-term one ― something that just recently happened and that was likewise caused by some individual or event in the recent past.
In contrast, the BOTG in Figure 31b shows a system-based description of your friend’s car problem. That graph shows two trends: (1) the monthly gas mileage of the car and (2) the amount of oil added to the crankcase each month. This BOTG provides a much more informative description of the problem. Moreover, it shows that the problem has been developing over several months.
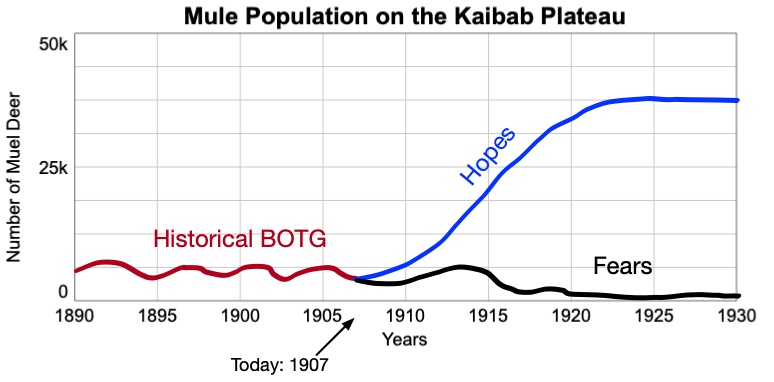
In the case of the Kaibab Challenge, a reasonable BOTG would be an historical trend line showing the size of the mule deer population on the Kaibab Plateau, augmented with future trends showing both what your client hopes for the future and what they fear, if an effective set of policies is not identified. See Figure 36. This graph shows that (in keeping with the historical record), the deer population has been relatively stable. The hope is to manage the ecosystem in a way that could help the deer population flourish and grow to a larger size. The fear is that the population will not grow and might even decline.
Problem Statement
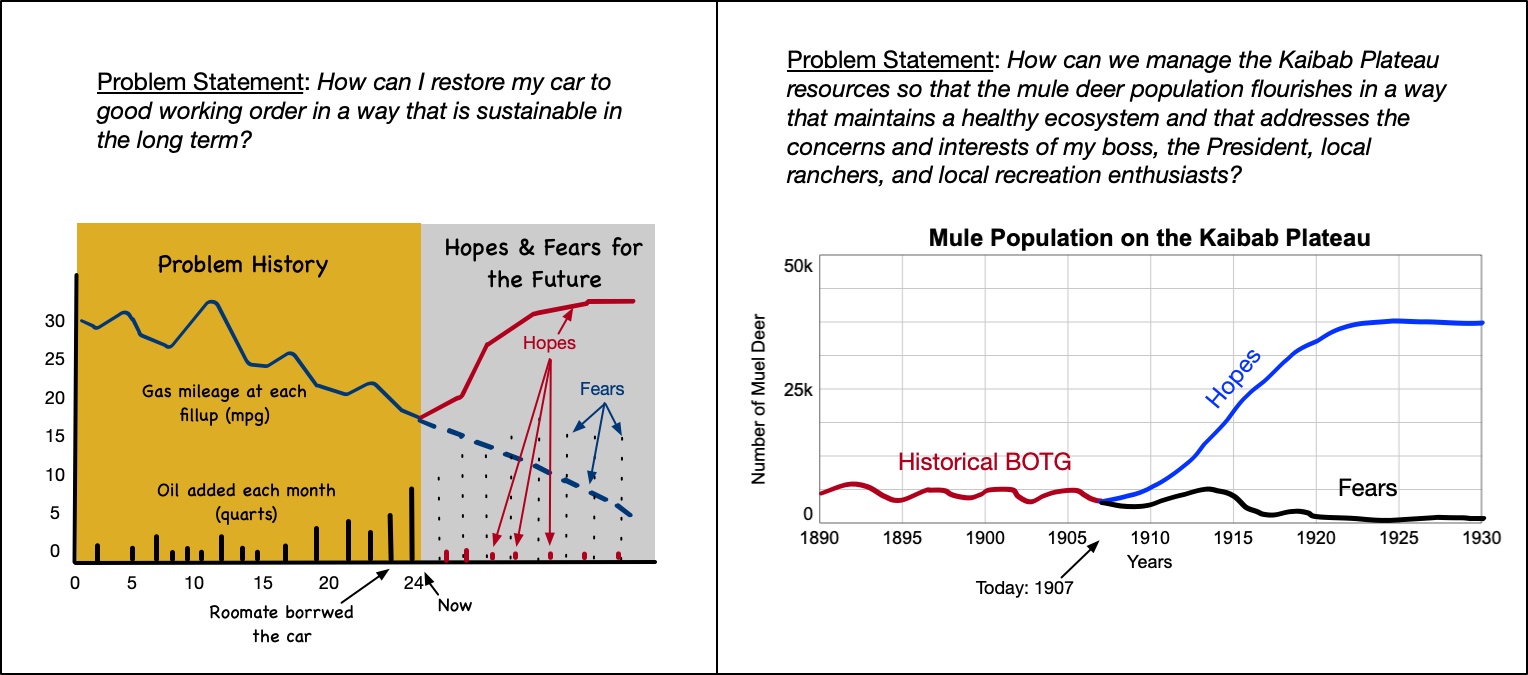
A problem statement is a concise statement describing the challenge that your client must address in order to successfully respond to the problem. The problem statement should reflect the aspirations represented in the BOTGs, and should also address the requirement that the policies that are ultimately adopted be supported by the stakeholders. One way of formulating a problem statement is to state it in terms of a question of the form: “How can I (describe what the decision maker wants to accomplish…refer to his hopes in the BOTGs) in a way that (describe any particular stakeholder needs he wants to keep in mind)?”
This generic question should be adapted to specifically address the context of the problem. Figure 37 shows two example problem statements ― one for your friend’s car problem, and one for the Kaibab Challenge.
Success Criteria and Balanced Scorecard
Given the problem statement and stakeholder interests, how will your client compare policy options to identify those that show the most promise? That is, what are the criteria by which they will judge the outcome of their efforts? In general, your client’s success criteria will correspond to some version of their “hopes” that are shown as a future trend on the BOTGs. However, their success in addressing the problem will also depend on both short-term and long-term outcomes and on how their policies impact the other stakeholders.
It is seldom the case that any one solution can make everyone happy. What is important is that the decision maker and the stakeholders can clearly see the tradeoffs of different policy choices and recognize the sometime incompatibility of their respective goals. For example, if your friend wants to repair his car, but is not willing to spend any money to that end, he likely has a very unrealistic goal. On the Kaibab Plateau, your boss and President Roosevelt may want to see the mule deer population grow to a steady state of 40,000 deer, but the ecosystem may not support that. The hunters may want to hunt the deer and the predators, but such activities have to be closely regulated to avoid over-hunting either population and upsetting a delicate balance between predators, prey, and the forest.
How can one weigh all of these competing interests? One powerful tool for doing this is to build into your model a series of simulated BOGTs that represent the interests of each of the stakeholders. For example, with the Kaibab Challenge, the following BOTG’s would be very useful:
- Graph of the mule deer population over time (of interest to your boss and the president).
- Graph of the predator population over time (of interest to the hunters, ranchers, and ecologists who work on the Kaibab)
- Graph of the forage supply in the Kaibab forest for sustaining the deer population (of interest to tourists who visit the Kaibab, as well as ecologists)
- Graph of hunting permits for hunting deer and for hunting predators (of interest to the hunters in the area)
- Graph of the livestock using the Kaibab (of interest to the ranchers in the area)
A collection of graphs like these comprise a balanced scorecard for evaluating alternative policies for managing the Kaibab. A balanced scorecard is a set of BOTGs that collectively represent the interests of your decision maker and the stakeholders that they have to keep on board as they make changes. By incorporating such a scorecard into the interface of your model, your decision maker and the stakeholders can clearly see the tradeoffs from different policy options.
Stage 2: Create a Model, Test, and Build and Interface
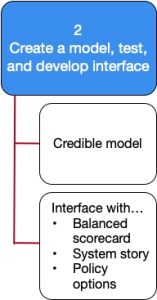 In Stage 1 we define the problem. In Stage 2 our task is to identify the stocks, flows, feedback structure, and equations that represent the driving forces behind problem. It is important that this work be done in collaboration with the decision maker and stakeholders. Otherwise, the resulting model may reflect only our own personal perspective, or the perspective of the decision maker, without accounting for the roles of the other actors that impact the system. The process of “group model building” is a sophisticated way of engaging the key players. The methodology for conducting group modeling sessions with stakeholders and decision makers is beyond the scope of this introductory text. However, there are a variety of resources available (Richardson and Andersen, 1994; Vennix, 1996; Beale, 2007; Tidwell et al., 2004).
Figure 37 identifies two outcomes from this stage of the modeling effort: (1) a credible model that is endorsed by the decision maker and stakeholders, and (2) a user interface that includes the balanced scorecard, a system story, and options for exploring different policies.
Credible Model
A credible model is one that has passed sufficient testing as to give us confidence when using it for evaluating policies. Such a model will seldom predict the future with exact certainty and precision, but it can help us see what sorts of actions lead to improved results, and which ones will make things worse. In addition, the structure of the model gives us insights into why some policies will work, while others will fail. These kinds of insights help us address the problem in a more informed and nuanced way that accounts for the complex feedback dynamics that are relevant to the problem.
There is a well-established array of tests that can be applied to a model to evaluate its credibility (Sterman 2000; ). For the purpose of the current discussion, we will point out three important types of model evaluations that you have already used in a limited way. These are by no means exhaustive nor sufficient for a full evaluation of a model. Our purpose here is to acquaint you with the concept of model evaluation and help you to see how you have already done that in a limited sense. A more extensive coverage of this topic can be found in Sterman (2000) and Richardson and Pugh (1981).
- Structural tests: These tests are aimed at evaluating if the logical stock and flow structure of the model (including causal links, equations, and feedback loops) is consistent with what “experts” have told us about the system? These experts will include (but not be limited to) the decision maker, stakeholders, and subject matter experts who are familiar with the cause-effect relationships at work in the problem. This type of evaluation inevitably requires the involvement of those who will use the model and those who have domain expertise about the underlying system. One of the primary benefits of group model building is that these individuals are involved in creating the model’s stock and flow structure. This is an important step toward assuring structural validity.
- Dimensional consistency: Are the units for all variables specified in such a way that makes physical sense and that is consistent across the model? That is, are the unit specifications consistent with the physical meanings of those variables and how those variables are used in the model equations and stock/flow structure?
- Behavior reproduction: Does the model reasonably mimic past known behavior (as shown in an historic BOTG? While this is an important step in model evaluation, it is, at best a minimal requirement and can be given too much weight. Many different models can produce the same historical output, even though their underlying stock and flow structures and logic are very different. In such a case, other tests (structural, dimensional, etc.) are critical for picking the best model.
Interface with a Balanced Scorecard, System Story, and Policy Options
In order for the model to be useful by the decision maker and stakeholders, it’s important to provide an intuitive user interface like those you’ve already developed in this text. That interface should include a system story that helps the user learn about the model’s feedback structure and how that structure drives the system behavior over time. This will help users “make sense” of model output that might defy their intuition,
In addition to a system story, your interface will include “policy knobs” or “policy switches” that the user can adjust to explore the impact of various policies. These knobs and switches are provided through controls (sliders, dials, etc.) on the interface that enable the user to adjust those things in the system that they have control over. Switches can be employed as off/on toggles to turn on certain new structures representing new ways of running things.
Finally, your interface should provide access to a collection of BOTGs that together comprise the balance scorecard for your decision maker and stakeholders.
Stage 3: Use the Model to Explore Options
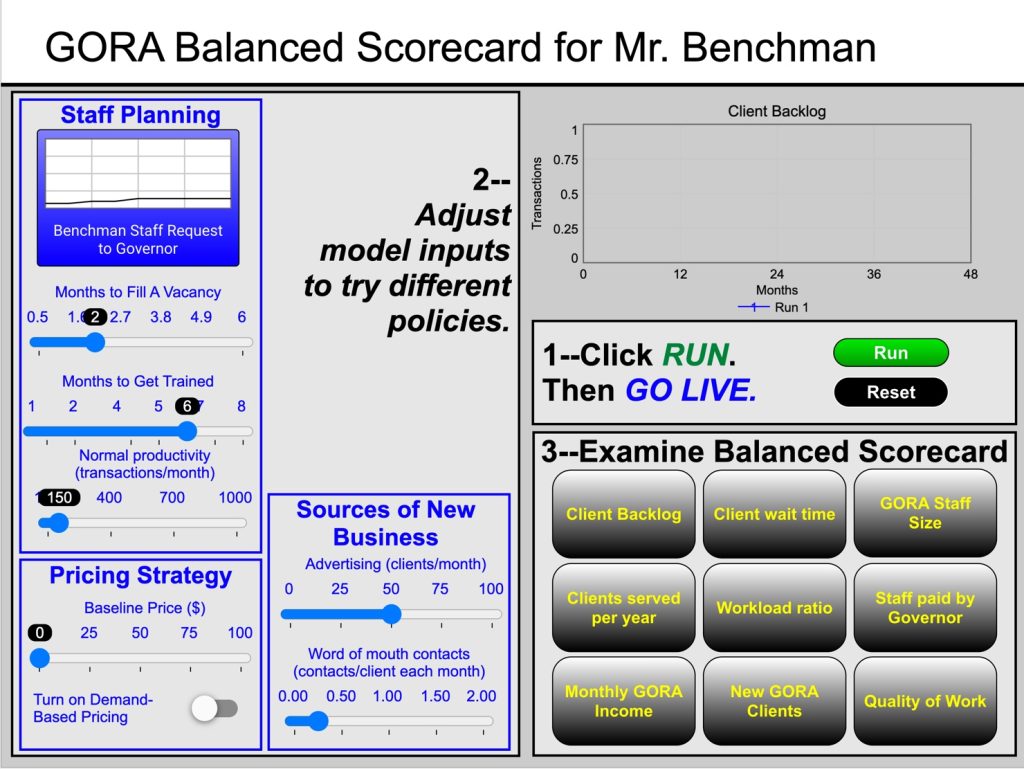
 Now armed with a credible simulator and user interface, you can work with your decision maker and stakeholders to run the model and evaluate different policy options for responding to the problem. This stage can be quite fun and engaging. It is often done in a group setting, with someone running the simulator and the group viewing and discussing the results. Each run requires the user to specify a group of settings on model parameters that represent some policy under consideration. If this scorecard was designed correctly, everyone can readily observe how their interests are impacted under various scenarios. This analysis leads naturally into the last phase of the project.
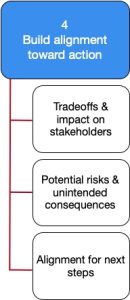
Stage 4: Build Alignment Toward Action
The purpose of the modeling project is to provide decision makers with the insights they need to take effective action. That means that their plans have been subjected to the kind of analysis conducted in Stage 3. The impact of different policies on all stakeholders has been explicitly evaluated. All the key players have had a chance to explore those options, and to explore options of their own ― all the while considering the broader impact on the rest of the system and the other stakeholders.
In Stage 4, all of this analysis is consolidated and evaluated to identify courses of action that offer an appropriate tradeoff of all the competing interests the room.
We now illustrate this four-step process with a realistic case study. This case study will provide a broad-brush overview of what the four stages in Figure 34 might look like in practice, without belaboring all the details.
5.2. Case Study: The Governor’s Office of Regulatory Assistance[1]
5.2.1. Your Role: Help GORA Solve a Problem
You have been hired by Eliot Benchman, Director of the Governor’s Office of Regulatory Assistance in the State of Goodwill to find ways to meet a mandate from the Governor to rapidly expand the agency’s services over the next several months.
5.2.2. Background: A New Agency and a Successful Pilot
Madeleine Talbot was elected Governor of the State of Goodwill on a platform that stressed economic development and new job creation. An important promise in her campaign was to promote small business development by “cutting the red tape” caused by government regulation. To follow through on her campaign promises, Talbot has established the Governor’s Office of Regulatory Assistance (GORA) and appointed Eliot Benchman as its Director.
GORA’s mission is to assist entrepreneurs who wish to start new business ventures in the state by providing information on government regulations and by assisting them with state, local, and federal regulatory bodies. For example, GORA gives out information on how to incorporate, file employee taxes, get local building permits and zoning approvals, fill out and comply with federal corporate tax requirements, health insurance laws, and so on. To a large degree, GORA’s mission is to provide quick and easy “one stop shopping” for information about government regulations. Occasionally, staff at GORA provide technical assistance by helping entrepreneurs get started or by helping a larger industry deal with complex environmental regulations.
GORA launched a pilot program in the mid-state region. The pilot included only 7 staff in the GORA office, plus Benchman. The launch was a high-visibility event, with considerable press coverage announcing the new “red tape busters” created by Governor Talbot’s administration. A toll-free 800 line was established for prospective GORA clients. GORA’s staff soon had a number of high visibility successes that were reported in the press. The agency quickly developed a strong reputation for competence and quality work.
5.2.3. The Challenges from Success
Based on that early success, the Governor’s office has directed Mr. Benchman, to scale up the agency in order to provide the same service across the entire state. Benchman is concerned about his agency’s capacity to expand so quickly. For example, GORA staff so far processed about 1000 clients per month. Records indicate that, if GORA were to cover the entire state, the volume of activity would increase 30-fold over the current workload.
In addition, GORA’s early success has come at a price not evident to those outside the agency. Staff are overworked and overstressed. Their first year has been nothing short of chaotic, and everyone feels lucky to have avoided major mistakes that would tarnish the agency’s reputation. Immediately after the grand opening one year ago, GORA processed about 250 clients per month. Six months later, this volume had increased to 500. At the end of its first year, this number had reached 1,000 clients per month ― all because of the agency’s growing reputation.
The burgeoning workload caused severe growing pains within the organization. After only a few months, the workload was so demanding that Benchman sought and received funding from the Governor Talbot’s office to provide overtime pay for his staff. This brought some relief in the short term. Staff appreciated the extra pay, and they were willing to put in the extra time because they were committed to GORA’s success. But after six months of operation, staff were “running on fumes.” Benchman consequently sought and received authorization to expand from 7 to 10 employees.
Unfortunately, due to the inevitable delays in state bureaucracy, it took nearly four months to bring the new people on board. In addition, because of the intense workload, GORA staffed lacked the time train the new people. Benchman was in a tough bind: the new staff lacked the necessary skills to do the job, but the experienced staff were too swamped to spend time training them.
It even seemed like adding new staff was making things worse! The client backlog had continued to grow; overall productivity was down; experienced staff were still working long hours; overtime was now mandatory. Two of GORA’s best employees had already resigned, citing burnout and the high pressure of the job.
Benchman fears that GORA is entering a cycle of low morale and high staff turn-over that has been characteristic of so many other state agencies where he had worked in the past. Things might even get worse if the program were expanded to the entire state.
5.2.4 The Goal for the GORA Project
The budget for GORA’s second year of operations is due soon and Benchman is evaluating GORA’s operations to better understand if, how, and over what time frame he can expand GORA’s mission to the entire state while sustaining a high level of goodwill with all his stakeholders.
With Benchman’s help and the input of the other stakeholders (GORA employees, GORA customers, the governor’s staff), you have built a system dynamics model including a user interface and balanced scorecard to help Benchman evaluate his options.
5.3. Using the 4-Stage Process with the GORA Problem
 Stage 1: Define the Problem
Stage 1a: Decision Maker and Stakeholders
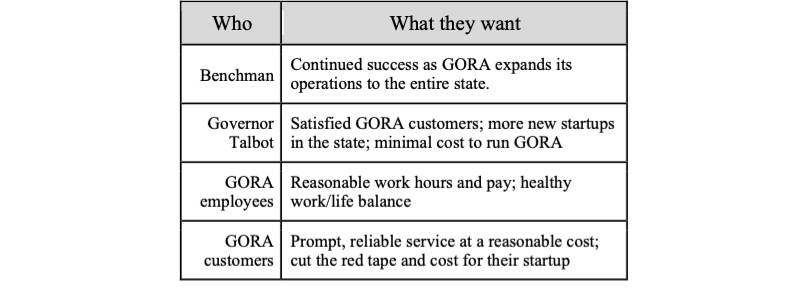
The decision maker for this problem is Eliot Benchman, Director of GORA. The stakeholders include Governor Talbot, GORA employees, and GORA customers. Each of these are concerned about different things. The table below summarizes each person or group’s interests in the problem.

Exercises 5.1: Team Modeling Activity – Stage 1 – Define BOTGs, the Balanced Scorecard, and Problem Statement for the GORA Problem
- Below is a list of possible variables whose time trends could be useful for representing the interests, hopes, and fears of Benchman and the other stakeholders. For each stakeholder, select 1 or 2 variables that closely represent their interests. In the corresponding cell of the table, briefly describe the success criteria that the stakeholder would apply to that variable. That is, for any given policy, what sort of BOTG and numeric values would that stakeholder like to see in order to support the policy?
|
Possible Variable to Track Over Time
|
Whose interests does the variable represent? What constitutes “success” in their eyes? | |||
|---|---|---|---|---|
| Benchman | Governor Talbot | GORA Employees | GORA Customers | |
|
# GORA Employees by Month
|
||||
|
# Customers Served by Month
|
||||
|
GORA Budget by Month
|
||||
|
# Complaints from GORA Customers by Month
|
||||
|
Average Wait Time Until Served by Month
|
||||
|
Average Workweek Hours for GORA Employees by Month
|
||||
|
# GORA Customers Waiting to be Served by Month
|
||||
|
GORA Income by Month
|
||||
|
GORA Clients by Month
|
||||
- Now develop a draft balanced scorecard for this problem as follows
- Based on the choices you made under #1, identify what would go on the Y-axis of 1-2 BOTG’s for each person or group listed in the above table. Each of these Y-variables should be taken from the 1st column of the table under #1. You should end up with somewhere between 4 and 8 variables to plot over time.
- Sketch a separate BOTG for each variable you identified under (a). Place time (in months) on the X-axis and the variable you chose on the Y-axis. Use the background for this case study to estimate and sketch a time trend on each BOTG running from GORA’s start 12 months ago up to the present.
- Sketch on each graph the hopes and fears for the next 48 months. These hopes and fears should represent the particular stakeholder for which the graph was developed. If one graph applies to more than one stakeholder, then consider whether each group has differing hopes and fears. If show these and label them accordingly.
- This collection of BOTG’s comprise your draft balanced scorecard. The simulation model you build would need to provide the particular BOTGs in this scorecard.
3. Now write down a problem statement for this project. This should state what Benchman hopes to accomplish. Formulate your problem statement by completing the sentence below:
“How can I (describe what he wants to accomplish…refer to his hopes in the BOTGs) in a way that (describe any particular stakeholder needs he wants to keep in mind)?”Type your exercises here.
Stage 3: Use the Model to Explore Options
One of the great advantages of having a credible simulator and user interface is that the decision maker and stakeholders can each run experiments to see how different sorts of actions might impact the future. It is sometimes the case that some policy options are already under consideration. It may also be the case that new options will emerge by experimenting with the model and considering both how and why the system responds in the way it does.
For the purposes of the GORA exercise, we already know that Benchman is considering adding more staff to GORA, in hopes that this move will position him to expand GORA’s operations to the entire state and the expected client load of 30,000 clients each month. Benchman could implement new technology (automated systems, etc.) and/or improved training programs to increase worker productivity. Lastly, Benchman is considering charging a fee for GORA’s services. This would generate funds to support more staff without driving up the costs for the Governor. However, charging a fee might drive some customers away.
So, a good place to begin is to identify a few policy options that can be implemented in the model. One of those policy options should be a baseline “business as usual” case in which not significant changes are made to the system. This can serve as a point of comparison for other scenarios that are considered.
For the purposes of this case study, let’s suppose that, in addition to the “business as usual” case, Benchman will explore at least three other policies; ((1) hiring more people; (2) charging a fee; (3) increasing productivity via technology improvements). Others may come to mind, once the system response is evaluated and understood. Figure 35 below summarizes these policy scenarios.
| Policy | Control Settings on the GORA Interface |
| Business as Usual (one run) |
|
| Hire More Staff with no Service Feed (possible multiple runs) |
|
| Increase Worker Productivity | Figure out what settings to use to represent this case. |
| One Other Policy (try a combination of options) | Figure out what settings to use to represent this case. |
| Charge a Fee to Pay for More Staff (possible multiple runs) |
|
Exercises 5.2: Team Modeling Activity – Simulate Policy Scenarios and Evaluate Their Impact on Stakeholders
Use the online simulator to implement the scenarios in Figure 38. As you run each scenario, refer to the table you made in the earlier exercise and then check the balanced scorecard to see how that scenario impacts the interests of each stakeholder, when compared to the business as usual (BAU) case. Find what you consider to be the best results for Benchman under each scenario. In the table below, write a “+” to indicate that scenario leads to better results, compared to BAU; write a “0” to indicate that the scenario leads to roughly the same results, compared to BAU; write a “―” to indicate that the scenario leads to worse results, compared to BAU.
| Stakeholder | Scenario (Compare with BAU Case) |
|||||||
| BAU | Increased Worker Productivity | More Staff | Months to Fill a Vacancy | Reduced Training Time | Pricing Strategy | Demand Pricing Turned On | Your Combined Scenario | |
| Benchman | Use as Baseline | |||||||
| Gov. Talbot | Use as Baseline | |||||||
| GORA Employees | Use as Baseline | |||||||
| GORA Customers | Use as Baseline | |||||||
Based on these results, are there any other scenarios that you’d like to simulate? If so, identify those scenarios and try them out on the online simulator. Record the impact of those scenarios on each stakeholder, as compared to the BAU case.
Stage 4: Build Alignment Toward Action
 Using the model to simulate scenarios, and then using the balanced scorecard to evaluate the impact of each scenario on the stakeholders should give the decision-maker a good sense of what is possible and how well each scenario meets his interests and the interests of the other stakeholders.
In this final stage of the analysis, it’s time to choose a course of action for addressing the original problem. This is not necessarily an black-and-white decision. Sometimes it’s impossible to find a policy that will fully satisfy the interests of all of the stakeholders. What is often the case is that some of the interests of all stakeholders can be satisfied, while others are compromised. Your job as a modeler is to help your decision-maker see the advantages and disadvantages of each policy option. One way of doing this is to outline the tradeoffs associated with each scenario (i.e. what benefits or harm each stakeholder might experience under each scenario) and then to make a final recommendation, based on that analysis.
Exercise 5.3: Team Modeling Activity – Identify Tradeoffs and Make Recommendations
- Based on the results from the previous activity, you should have a pretty good picture of the opportunities and costs that each stakeholder will experience under each of the scenarios. Summarize these tradeoffs in the table below.
| Scenario | Stakeholder | Explain the Impact of the Scenario on this Stakeholder |
| Business as Usual | Benchman | |
| Gov. Talbot | ||
| GORA Employees | ||
| GORA Customers | ||
| Increased Worker Productivity | Benchman | |
| Gov. Talbot | ||
| GORA Employees | ||
| GORA Customers | ||
| More Staff | Benchman | |
| Gov. Talbot | ||
| GORA Employees | ||
| GORA Customers | ||
| Months to Fill Vacancy | Benchman | |
| Gov. Talbot | ||
| GORA Employees | ||
| GORA Customers | ||
| Reduce Training Time | Benchman | |
| Gov. Talbot | ||
| GORA Employees | ||
| GORA Customers | ||
| Price Strategy | Benchman | |
| Gov. Talbot | ||
| GORA Employees | ||
| GORA Customers | ||
| Demand Pricing Turned On | Benchman | |
| Gov. Talbot | ||
| GORA Employees | ||
| GORA Customers |
- Based on these results, are there any other scenarios that you’d like to simulate? If so, identify those scenarios and try them out on the online simulator. Record the impact of those scenarios on each stakeholder, as compared to the BAU case.
- What do you think is Benchman’s best option for moving forward? Explain.
- This case study was adapted, with permission, from George P. Richardson’s and David Andersen and used in George's course, PAD 624, at SUNY Albany. GORA is a hypothetical and composite agency that provides both for the dissemination of information about government regulations as well as provides technical support for economic development projects. In many states, these functions are handled in separate agencies. For purposes of simplicity in the case, GORA does not become involved in regulatory reform, a common function to be associated with an agency such as GORA. ↵


Feedback/Errata