6 Chapter 6: Modeling Case Studies
In this section of the Learning Guide, you will have a chance to exercise your modeling skills with realistic and more open-ended problems involving decision-makers and stakeholders. In each case study, you will be given some guidance to help you apply the four-stage process outlined in Figure 34.
Some of these case studies are more challenging than others. Their level of difficulty is indicated with a CHALLENGE LEVEL rating.
- ENTRY level case studies are those in which either the models depend largely on building blocks you already know or extensive modeling guidance is provided.
- MODERATE level cases provide less prescriptive guidance for building your model, but whose model complexity has many similarities to what you’ve already seen in this text.
- ADVANCE level cases are the most open-ended of all. These cases will require you to construct a model with minimal prescriptive guidance.
6.1 Outbreak! Planning for a Deadly Flu Outbreak (Challenge Level: Entry/Moderate)
Today, worldwide, there is an apparent increase in many infectious diseases, including some newly-circulating ones (HIV/AIDS, hantavirus, hepatitis C, SARS, etc.). This reflects the combined impacts of rapid demographic, environmental, social, technological and other changes in our ways-of-living. Climate change will also affect infectious disease occurrence.”
Source: World Health Organization, 2014
6.1.1. Background: The local challenge from an emerging flu virus
Most years, seasonal influenza causes severe illness in three to five million people worldwide, and it kills hundreds of thousands of people. Occasionally, the spread and lethality of the influenza virus are more severe ― by many orders of magnitude. For example, an estimated 50 million deaths ― and perhaps as many as 100 million ― resulted from the 1918 global flu pandemic (see Figure 34).
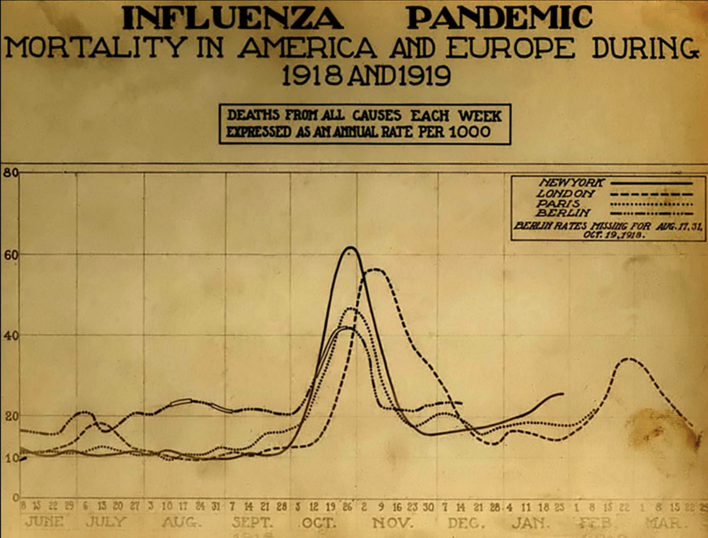
Since that time, other serious pandemics have occurred with significantly higher than normal morbidity and mortality[1]. The potential for such pandemics in the face of an evolving climate is considered to be one of the significant threats created by climate change.
Since 2003, 650 human infections with highly-pathogenic H5N1 viruses have been reported to the World Health Organization. These infections have come from 15 different countries. About 60% of people infected with this virus died from their illness. Fortunately, unlike other types of flu, H5N1 does not usually spread between people. In late 2019, COVID-19 was identified and kicked off a global pandemic that as of April 2024 had killed over 7 million people worldwide according to the World Health Organization[2]. and into 2020, the world faced such a pandemic with the spread of COVID-19.
What would happen if a virus like H5N1 acquired the capability of sustained human-to-human transmission? Researchers have used computer models to explore possible scenarios and to try to understand some of the factors that affect how influenza progresses in individuals and through a population. Along with genetic and social factors, the spread and severity of flu pandemics depend on environmental factors such as weather, humidity, temperature, and airflow. What impacts could global climate change have on the transmission, morbidity and lethality of possible emergent influenza strains? Answers to these questions are unknown. A good place to start is to build a baseline model for how such a disease might spread in a human population.
Your goal is to create, analyze and present a computer model of the spread of a serious influenza epidemic such as a highly-infectious H5N1 strain that has acquired the capability of human to human transmission. You will build your model to help public health officials in a local community evaluate different public health strategies for impacting the progression of the disease in their city.
You are part of a research team in the CDC’s Office of Infectious Diseases at the National Center for Immunization and Respiratory Diseases. Your team is concerned about the emergence of infectious flu-like and potentially deadly viruses like H5N1[3][4][5]. In particular, if this disease were to become infectious[6], what would be the impact? What would be effective strategies for curbing an outbreak before it became a local, or even global catastrophe, killing millions of people?
You have been tasked with developing a system dynamics model for exploring some of the above questions. As an initial pilot study, your model will focus on the city of Smallville, a college town of 50,000 people, having two regional hospitals that together have 520 beds.
In order to build the model, you must learn about the dynamics affecting how an infectious disease spreads through a human population, how victims progress through various stages of the disease, and how a disease impacts the local health care system. You will also explore the impact of such strategies as (1) an aggressive vaccination program, (2) the use of quarantine, and (3) the potential impact of “social distancing” (wearing face masks and avoiding contact with others) in curbing the spread of the disease.
You will develop a report for your boss, Dr. Sherry Constantine highlighting what you believe to be the best strategies for addressing a serious flu epidemic and also highlighting those ways in which a city like Smallville may find itself unable to respond to the crisis.
 Stage 1: Define the Problem
Stakeholders and Interests (see Table 6.1)
| Who | What They Want |
|---|---|
Dr. Sherry Constantine |
Dr. Constantine is your boss at the CDC and is the decision maker in this project. She wants to know the most cost-effective strategies for fighting an outbreak, should H5N1 become infectious. For example, does it make sense to mount an expensive campaign to develop a vaccine against the H5N1 virus? Or are there better ways to control the spread of the disease, should it become infectious? |
Smallville Director of Public Health |
This individual is concerned about the capacity of the city’s health care facilities for handling a severe H5N1-like flu outbreak. |
Local Citizens Group “Medicine no More” |
This group advocates against the use of vaccines, for fear that their use can lead to numerous health issues in children. This group advocates the use of “social distancing” (closing schools, using face masks, etc.) and quarantine (isolating sick people at home) to control the spread of the disease. |
Blue Dimond / Blue Square Insurance |
This is a health insurance company that provides health coverage for many of the people living in the city. Blue Diamond/Blue Square is concerned about the overall costs of such an epidemic, including the costs of hospital stays, medication, etc. |
Smallville Citizenry |
Local citizens are concerned that officials might infringe on their rights through heavy-handed restrictions on their ability to move about town and engage in business and other activities. They also want to be safe, should an outbreak occur. |
Behavior Over Time (Hopes and Fears)
Figure 39 shows the a typical BOTG for the flu season in the U.S. This particular graph shows the number of cases reported to U.S. doctors during the 2023-2024 flu season (running roughly from late September through the following June). This BOTG shows an early period of exponential growth, followed by a slowing in the disease spread until it nearly dies out after about 30 weeks. The duration of the outbreak is a function of how contagious the disease is, how wide of a geographic region is affected, and the level of contact between people across that region. Because this graph represents the entire U.S., one would expect that an outbreak in a town like Smallville would be over in a shorter time period (possibly much shorter), but that the shape of the BOTG would look roughly like this figure. While this graph represents the behavior of all influenza-like illnesses in 2023-2024, it is expected that an H1N5 outbreak would exhibit a similar overall pattern.
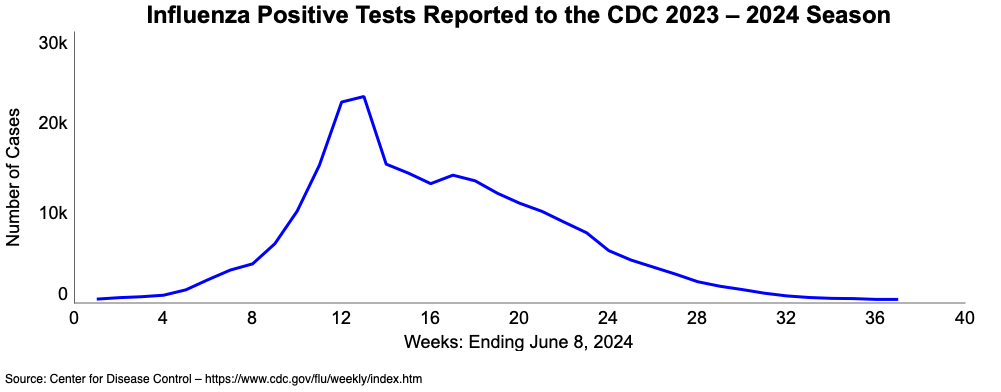
When tracking the progress of a disease over time, public health officials and other stakeholders typically track (among other things) the following:
- #Cases (by day and overall): The number of new cases of people exhibiting disease symptoms each day (similar to Figure 39), and the total number of cases so far.
- #Deaths: The total number of deaths from the disease so far
- #Hospitalized: The daily number of people requiring hospital care
- Cost: Cumulative cost of providing health care for disease victims
- #Inoculated: Number of people who are resistant to the disease because of vaccination (if a vaccine is available)
- #Quarantined: Number of sick people placed in quarantine
Exercise 6.1: Stage 1 – Define BOTG’s, the Balanced Scorecard and Problem Statement for the Outbreak Problem.
- Consider the six variables described above. A typical BOTG for the first variable (#Cases) will look like the graph in Figure 39. What would the BOTG look like for each of the other variables? Sketch a BOTG for each (5 graphs in all). Assume a 40-week time window similar to Figure 39. Make sure you label the Y-axis to identify what is being plotted. You need not worry about placing numeric values on that Y-axis.
- For each of the graphs you drew, plus the BOTG in Figure 39, sketch in what you think are the hopes and fears of the different stakeholders. If you think the same hopes and fears apply to more than one stakeholder, simply indicate which stakeholders are concerned. HINT: Up to now we’ve drawn the hopes and fears as extensions on the end of the graph. That’s because the BOTG shows the history of the problem, and because we are concerned about how things might play out in the future. In this case, however, the epidemic has not yet happened. Hence the entire BOTG (from week 0 up through week 40) is in the future. Your hopes and fears curves should be superimposed over the existing BOTG’s from week 0 to week 40, and they should show the BOTGs that the stakeholders most hope for or most fear in a future outbreak.
What about the balanced scorecard?
Your balanced scorecard will consist of a set of BOTGs from your model that correspond to the six variables listed above. Policies (such as using a vaccine or quarantine) will be evaluated by how well they result in BOTG’s that come closest to matching the hopes of the stakeholders, as shown on your sketches.
3. Now write down a problem statement for this project. This should state what your boss, Dr. Constantine hopes to accomplish. Formulate your problem statement by completing the sentence below:
“How can I (describe what she wants to accomplish…refer to her hopes in the BOTGs) in a way that (describe any particular stakeholder needs she wants to keep in mind)?”
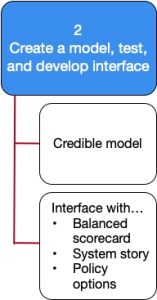
Stage 2: Create a Model, Test, and Develop an Interface
The basic stock and flow structure for a flu-like disease outbreak
One of the most common frameworks that epidemiologists use for describing how infectious diseases like the flu, HIV, Tuberculosis, COVID19 and others spread through a population is the SEIR model. The letters, SEIR correspond to the names of four stages through which people in a population might pass during a disease outbreak. You can think of these four stages as stocks containing people. There are flows running from one stock to the next. The four stages are listed below. The first letter of each stage is highlighted, indicating the four letters S-E-I-R.
Susceptibles. This stands for everyone in the population that could potentially get the disease. In the case of a disease like the flu or an infectious version of H5N1, the Susceptibles would be everyone in the population. That’s because each strain of the flu is unique from the previous year’s strain. If someone had the flu last year, they might be resistant to that particular strain, but not necessarily this year’s strain. Hence, everyone is susceptible. Of course, if some people have been inoculated with an effective vaccine for this year’s strain, they would be resistant and less likely to get the disease. For now, we will assume that there is no vaccine for H5N1. Hence, at the beginning, everyone is susceptible. If someone catches the disease from someone else, they move into the next stage.
Exposed. Every Susceptible person who is exposed to the disease and absorbs the virus into their body moves into the Exposed category. Exposed individuals have not yet shown symptoms and don’t know that they have the disease. That’s because their body’s immune system has not yet fully recognized the presence of the virus and has not kicked into high gear. An exposed person is hence asymptomatic ― they have no fever, no aches and pains ― no symptoms of the disease. Neither they nor anyone around them suspects that they are now contagious and about to get sick. Unfortunately, Exposed individuals can pass the disease to others. People who are Exposed will stay in this state for as long as it takes the disease to develop and show symptoms.
Infected. This stands for everyone who now has the disease and is feeling its effects (fever, aches, etc.). Infected individuals can continue to pass the disease along to others, just like Exposed people can. In addition, over the course of the disease, some fraction of Infected people will die. The disease typically lasts for a limited time, after which those individuals who survive and recover will advance to the final stage.
Recovered. This stands for those individuals who have recovered from the disease. These folks no longer show symptoms. While they may remain weak for a while, we will consider these folks to be fully recovered once they reach this stage. These individuals are not infectious: they cannot pass the disease along to anyone. In addition, they are resistant to the disease – i.e. they cannot get it from someone else.
Factors affecting the rates of flow between the S-E-I-R stocks
There are several things that impact how quickly a disease might spread and whether the disease can cause a serious epidemic. In terms of a stock and flow diagram, these factors affect the rates of flow between the S-E-I-R stocks in your system dynamics model. Each of these factors represents the physical characteristics of the disease and the social characteristics of the human population. Your model will need to account for the way these factors impact the stock and flow dynamics of the SEIR model.
Here are the flows that impact the stocks.
- Catching the Disease flow: The daily rate at which Susceptible people catch the disease and move to the Exposed stock.
- Developing Symptoms flow: The daily rate at which Exposed people begin to show symptoms of the disease and move to the Infected stock.
- Recovering flow: The daily rate at which Infected people recover and move into the Recovered stock.
- Dying flow: The daily rate at which Infected people die. Have these people flow into an additional stock called Infected Deaths.
Listed below are other variables that affect the flows (and hence behavior of the stocks over time)
- Infectivity: This refers to the likelihood that someone who comes in contact with an Exposed or Infected person will catch the disease. We don’t know what the infectivity of an H5N1 virus might be. Some infectious diseases have infectivities near 100% (say, 0.9), while others are quite low. Suppose that the H5N1 virus could have an infectivity somewhere between 0.05 and 0.9.
- Contact Rate: This refers to the typical number of times an individual has the kind of contact with others that could place them at risk of catching the disease. This is expressed as the number of such contacts per person each day, and it reflects the social nature of the community ― how mobile and physically connected people are. In remote rural regions, the Contact Rate will be smaller than in a large crowded city or on a college campus. In the case of the common flu, contacts involving only near proximity to an infected person is all that is necessary. In other types of diseases like HIV, more intimate physical contact is required in order to contract the disease. The higher the Contact rate, the more chances that a Susceptible person will come into contact with Exposed or Infected people, and the greater the chances that they will get sick. Assume that this contact rate is somewhere between 1 and 10 contacts per person each day.
- Infected Population – The number of people in Smallville that are contagious and could pass the disease to others. This would be the total number of Exposed and Infected people.
- Fraction of Population Infected – The fraction of Smallville residents that are carriers of the disease and that can therefore pass it on to others. For example, suppose that only 1 out of 1000 people (0.1% of the population) were carriers. In that case, a susceptible person would be much less likely to have contact with a carrier than if 20% (1 in 5 people) were carriers.
- Number of Diseased Contacts per Susceptible – This stands for the average number of contacts with disease carriers that a Susceptible person has per day. It is a function of the number of Susceptibles and the Fraction of Population Infected.
- Initial Population: The number of people living in Smallville. This variable is important because it determines the initial number of Susceptible people.
- Current Smallville Population: This is the number of people in Smallville, after subtracting the number of deaths from the disease. This number is also used to calculate the Fraction of disease carriers at any point in time (calculated as the ratio of total Exposed and Infected to the Current Smallville Population.
- Incubation Time: The amount of time it takes for an Exposed person to start showing the symptoms of the disease. For diseases like HIV, the Incubation Time can be years. For the flu, the Incubation Time is a matter of days. During the Incubation Time, the victim is already contagious.
- Recovery Time: the average amount of time it takes someone to recover from the disease. In the case of some diseases (HIV) no one ever fully recovers. In the case of flu viruses like H5N1, the Recovery Time can be a few days to a few weeks. For this problem, assume that the Recovery Time is somewhere between 10 and 25 days.
- Daily Death Fraction: The fraction of Infected people who die from the disease each day. Because 60% of past H5N1 victims have died (over what typically a 15-day battle with the disease), CDC epidemiologists estimate that the Daily Death Fraction could be somewhere between 0.03 and 0.20.
Exercise 6.2: Modeling Challenge: Stage 2a – Baseline Stock and Flow Structure
Create a a stock and flow diagram in Stella Architect® showing all of the stocks, flows, and other variables described so far.
- Make sure you show all causal links and link polarities.
- Identify all feedback loops with circular R and B markers.
- Give each loop a descriptive name.
- Provide physical descriptions of all the variables in your diagram.
- Where you can, write down the units for that variable (assume time is measured in days).
- If possible, specify equations for variables whose values are determined by other variables in the system. (NOTE: You may not be able to create the equation for the Exposure flow feeding from the Susceptibles stock to the Exposed stock. Extra kudos if you can figure this out before class time!)
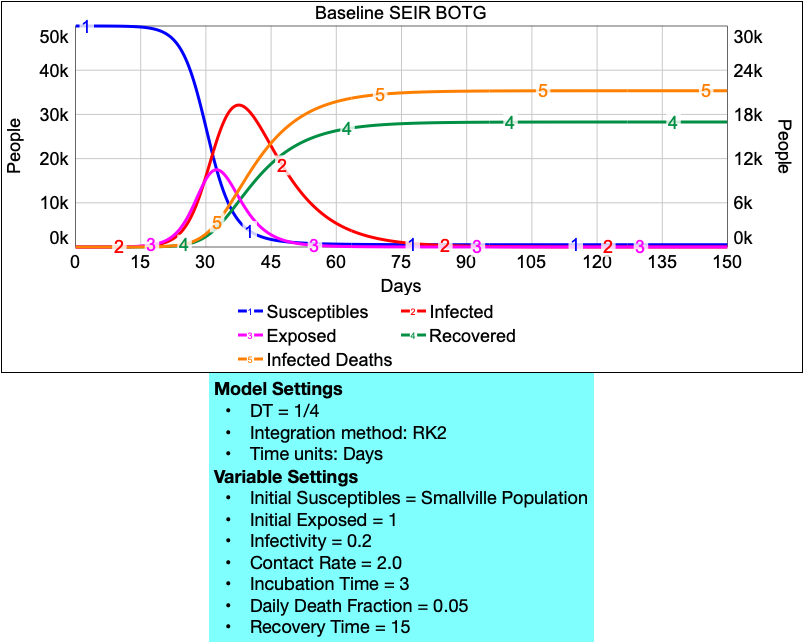
Below is a BOTG showing the output of the model under the indicated conditions.
Extending Your Model to Account for Policies
Now that you’ve built a model that mimics the behavior of a typical infectious disease outbreak, you can add features to the model to account for the policies that your decision maker (Dr. Constantine) wants to consider. Later we’ll discuss how to add features to the model to also account for the concerns and interests of the other stakeholders. Together these additions will provide a means for evaluating the impact of different policies in light of the concerns and interests of all the stakeholders.
Dr. Constantine wishes to evaluate which of the following policies (or combinations of policies) offer the most hope for an effective response to a possible outbreak of H5N1. We briefly outline them here and then provide you with some guidance on how to add structure to the model to account for these.
- Policy option #1 – Inoculation: Develop a vaccine for H5N1 (estimated cost: $200 million) and use it to inoculate the population. Inoculation effectively removes people from the Susceptible stock and places them into a new Inoculated stock from which they cannot contract the disease.
- Policy option #2 – Quarantine: Place in quarantine those individuals showing disease symptoms. The quarantine would last until they recover (or die).
- Policy option #3 – Social Distancing: Promote social distancing (self-quarantine) by providing daily updates on news media and by distributing to the public resources such as face masks and antiseptic hand cleansers. This effectively reduces the contact rate for those who participate in the social distancing effort.
Exercises 6.3: Team Modeling Activity Stage 2b – Modeling Policy Option #1 (Inoculation)
Work in teams to modify your baseline S-E-I-R model to explore the impact of an inoculation policy. Assume that the policy has these features:
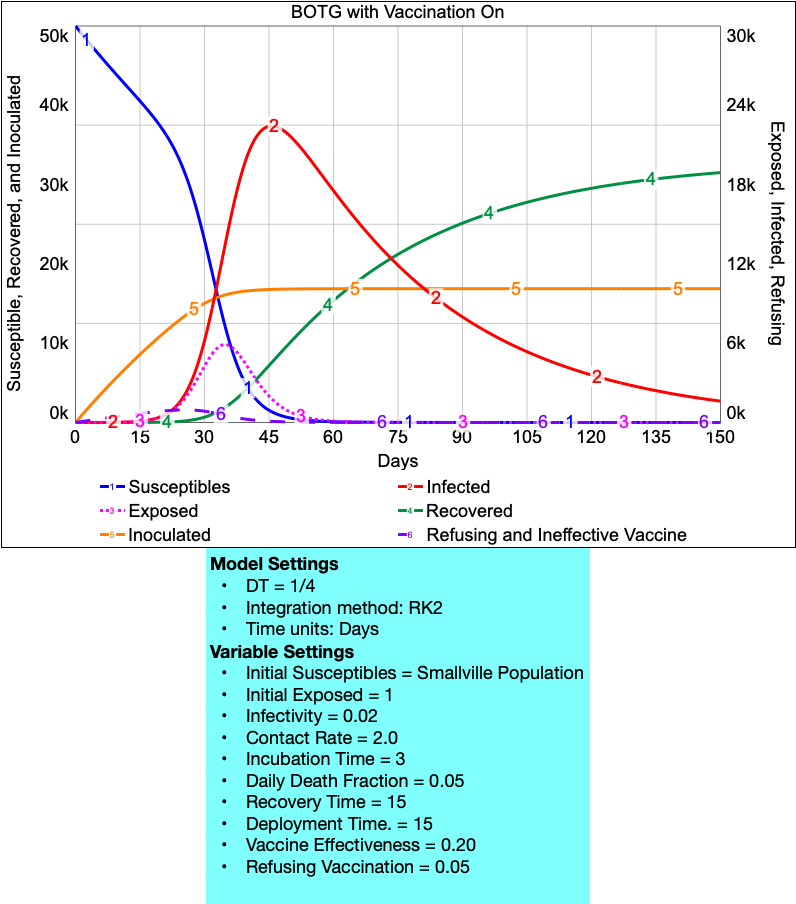
- The vaccine is not perfect. Only some of the people who are vaccinated actually become resistant. For those on whom the inoculation DOES WORK, they will no longer be Susceptible and will flow to an Inoculated stock. For those on whom the vaccine DOES NOT WORK, they will flow into a stock of Susceptible Refusing and Ineffective Vaccine. The people in the Susceptible Refusing and Ineffective Vaccine are now in a stock of people who can still become sick. If they become sick, they will flow into the Exposed stock.
- Add a new variable called Vaccine Effectiveness to stand for the chances that the vaccine is effective on any given person. Assume a default value of 0.2 for this quantity, but allow it to be adjusted anywhere between 0.1 and 0.9 (i.e. the vaccine is somewhere between 10% and 90% effective).
- It takes time to deploy the vaccine. In a town the size of Smallville, assume that it will take between 10 and 30 days to deploy the vaccine. Create a new variable called the Deployment Time to represent this quantity. Assume a default value of 15 days, with an adjustable range running from 10 to 20 days (depending on how many public health resources are used for the inoculation effort).
- Some fraction of the population will not be vaccinated. They either are unaware that it is available, or they might object to being vaccinated for personal reasons (religious, or skepticism about using vaccines, etc.). Let the variable Fraction Refusing stand for this group of people. Assume a default value of 0.05 (5% not vaccinated), and allow this to be adjusted in the range from 0.01 and 0.2.
- Sketch out on the board (or poster paper) how to add an Inoculated stock and a flow called Getting inoculated to the baseline S-E-I-R model. Add all the variables named here. Write on the board their units and all the causal links and polarities. Then write beside the flow the equation for calculating its value.
- Add a variable called the Vaccination Switch that you can use to turn the inoculation policy on or off.
- The Vaccination Switch variable will have a value of either 0 or 1, where 0 means “policy is OFF” and 1 means “policy is ON.”
- Set the default value of this variable to be 0
- Set the Input range to run from 0 to 1 with a Precision of 1. This will restrict you to having only the values of 0 and 1.
- Use the variable as multiplier times the entire equation for the Getting Inoculated When the policy is OFF (i.e. Inoculation switch = 0), there will be no flow into the Inoculated stock. When the policy is ON (Vaccination Switch = 1), the Getting Inoculated flow will work as determined by its original equation.
Once you finish, each person should build the model in Stella. Your BOTG should look one shown here. Note that the Inoculated stock has been added to the graph and uses the left-side Y-scale.
Exercises 6.4: Stage 2c – Modeling Policy Option #2 (Quarantine)
Now take the model with the Inoculation stocks and flows and add to it additional structure to account for the Quarantine policy. Assume that Quarantine policy works in this way:
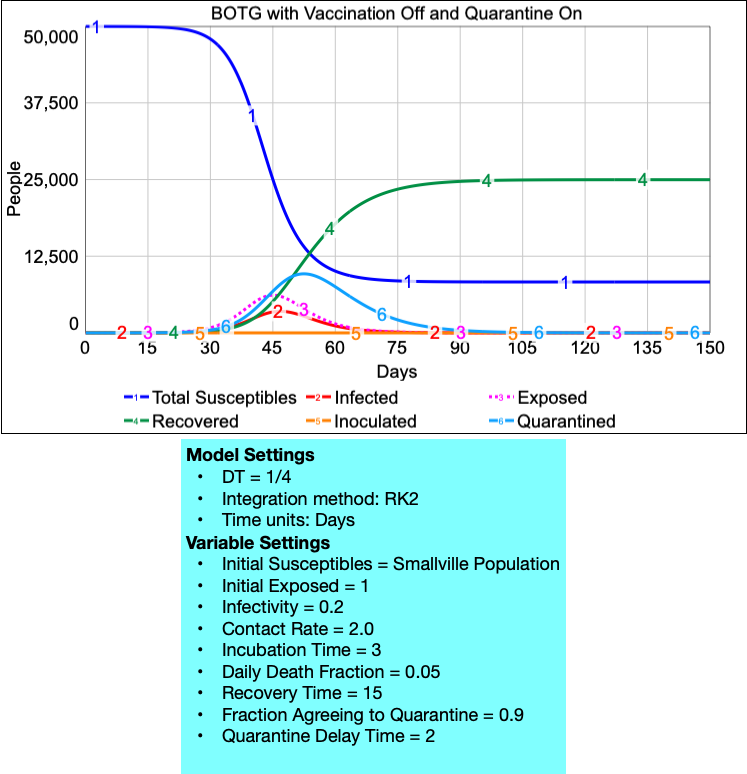
- When people are placed in quarantine, they are moved from the Infected stock into a Quarantined stock. You will need to add this new stock into the model, along with a flow into it from the Infected stock. Also add a Moving to Quarantine flow to allow people to move from the Infected stock to the Quarantined stock.
- There is a delay from the time someone develops symptoms until the public health officials are aware of their condition and move them into quarantine. Until that time, they remain in the Infected stock. Call this delay the Quarantine Delay Time. Give it a default value of 2 days, and allow the user to adjust it between 1 and 4 days.
- Health officials are hesitant to force people into quarantine, because of the risk of public backlash. Because of this, only a fraction of people who are Infected actually agree to be quarantined. Call this the Fraction Agreeing to Quarantine. Use a default value of 0.9 (i.e. 90% agree to quarantine), but allow it to be adjusted in the range from 0.5 to 0.9.
- Set up a Quarantine Switch (values of 0 or 1) to turn this policy off or on in the same way you set up the Inoculation Switch earlier. Set the default value to be 0 (“off”), and set the Input range and Precision accordingly.
- People in the Quarantined stock can still die (with the same Daily Death Fraction as before). Set up a stock called Quarantine Deaths to capture those quarantined individuals who die and use a flow called Dying in Quarantine to move people from the Quarantined stock into this new stock.
- Also, many people in quarantine will recover and move into the Recovered stock. The amount of time until this happens is equal to the same Recovery Time as before, minus the amount of time it took before health officials moved them into recovery (i.e Recovery Time – Quarantine Delay Time). Set up a flow called Recovery from Quarantine to account for this.
With these facts in mind, use the board or poster paper to add the appropriate stock and flow structure to the model, along with the causal links, link polarities, and feedback loops. Specify the units and equations for the new variables. Each person should then add the new structure to their Stella model. Your BOTG with the Quarantine policy ON but the Inoculation policy OFF should look like the one shown here. Notice that the Quarantined and Quarantined Deaths stocks have now been added to the graph on the right axis.
Exercises 6.5: Team Modeling Activity: Stage 2d – Modeling Policy Option #3 (Social Distancing)
Start with the model showing the stock and flow structure for the Inoculation and Quarantine policies. Add to it the structure to account for the Social Distancing policy. This policy will be implemented as follows.
- Create a Social Distancing Switch similar to the one you created for the Inoculation and Quarantine policies.
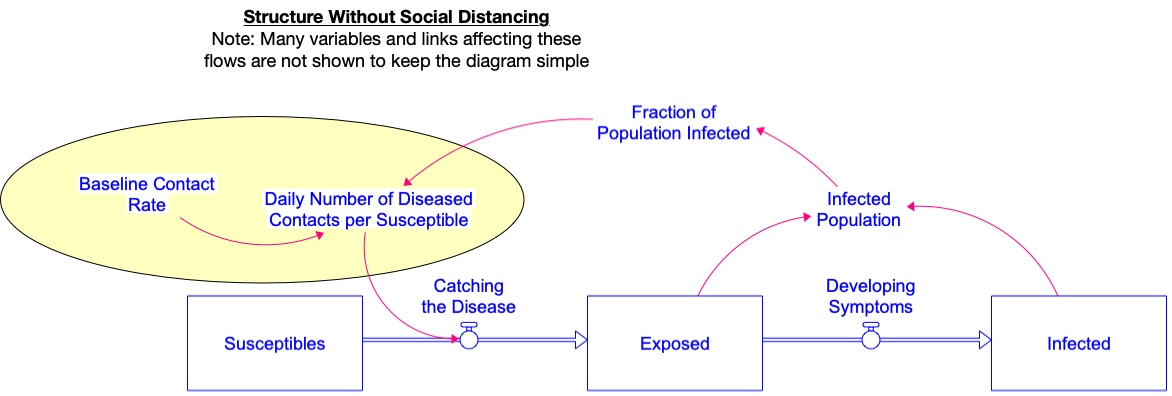
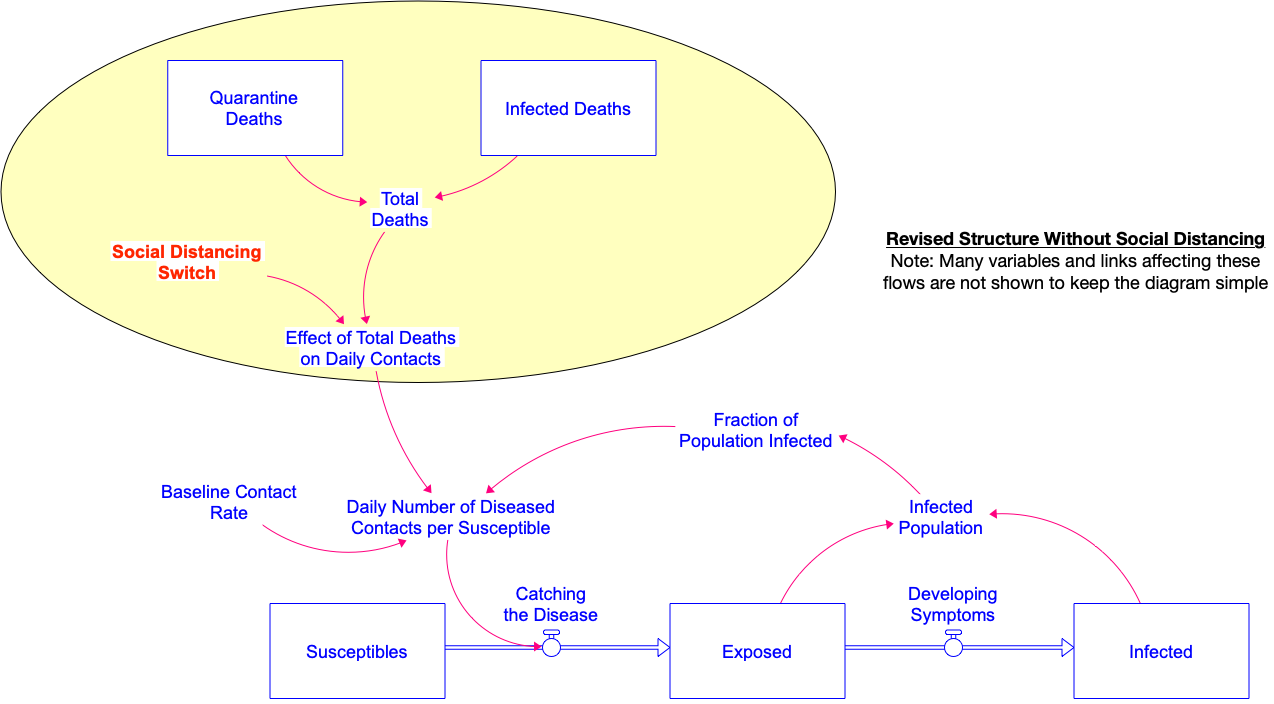
- Create a new variable called Total Deaths to account for the number of people that have died from the disease so far. The idea is that, the higher the number of deaths, the greater the level of social distancing that people will exercise (by wearing face masks, avoiding contact with others, washing hands, etc). Total Deaths will be the sum of the two stocks Infected Deaths and Quarantine Deaths.
- Create a dimensionless variable called the Effect of Total Deaths on Daily Contacts.
- This variable will be used as a multiplier to scale down the Daily Number of Diseased Contacts per Susceptible (from the baseline model) as a result of social distancing. When this Effect of Total Deaths on Daily Contacts variable is zero, then the Daily Number of Diseased Contacts per Susceptible will remain unchanged from its original value. When this Effect of Total Deaths on Daily Contacts is greater than 0, the Daily Number of Diseased Contacts per Susceptible will be decreased by a factor of (1-Effect of Total Deaths on Daily Contacts).
- This variable will be a graphical function determined by the product of the Social Distancing Switch and the Total deaths. Here is what you can use for the graphical function.
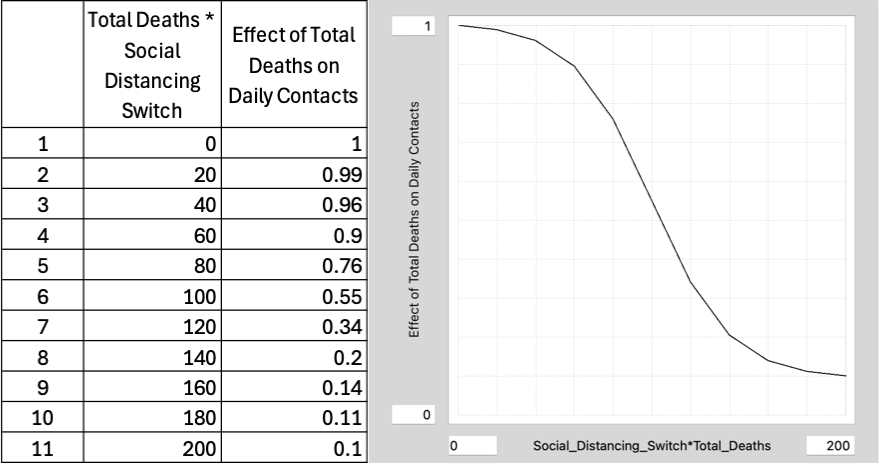
- ○ When the Social Distancing Switch is OFF, this Effect of Total Deaths on Daily Contacts will be zero. When the Social Distancing Switch is ON, this product will simply be equal to the number of Total Deaths.
- ○ To help you with the system structure, below is a diagram of part of the model, showing how the Total deaths, Social distancing switch and the Effect of Total Deaths on Daily Contacts variable fit into the model structure.
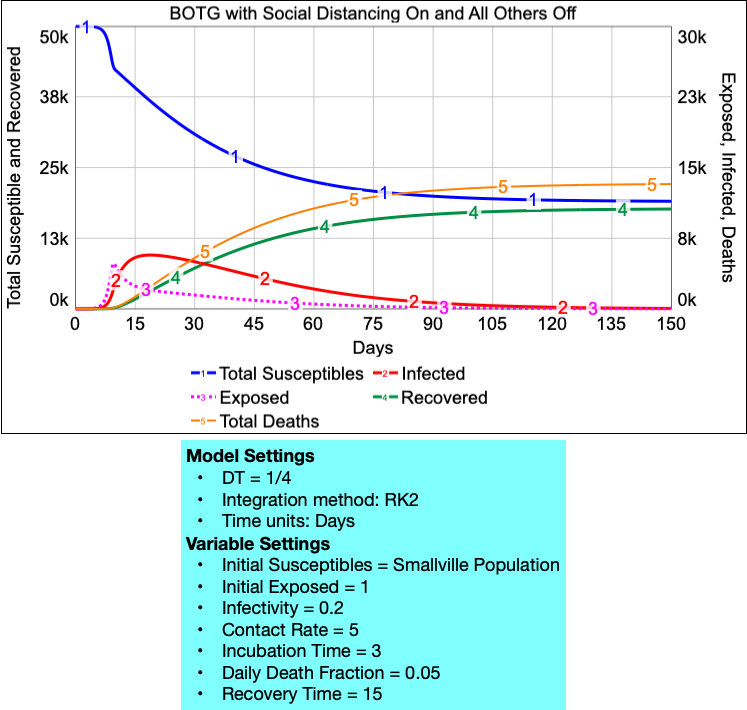
- ○ Also below is a BOTG showing the system behavior when social distancing is ON (and all other policies are OFF). Notice that this graph shows the Total deaths (Infected deaths + Quarantine deaths) on the right axis.
Monitoring Stakeholder Interests via the Balanced Scorecard
The final step is to add features to the model that will account for the interests of the stakeholders and that will provide information that can be used to construct a balanced scorecard by which Dr. Constantine can evaluate the various policies she considers.
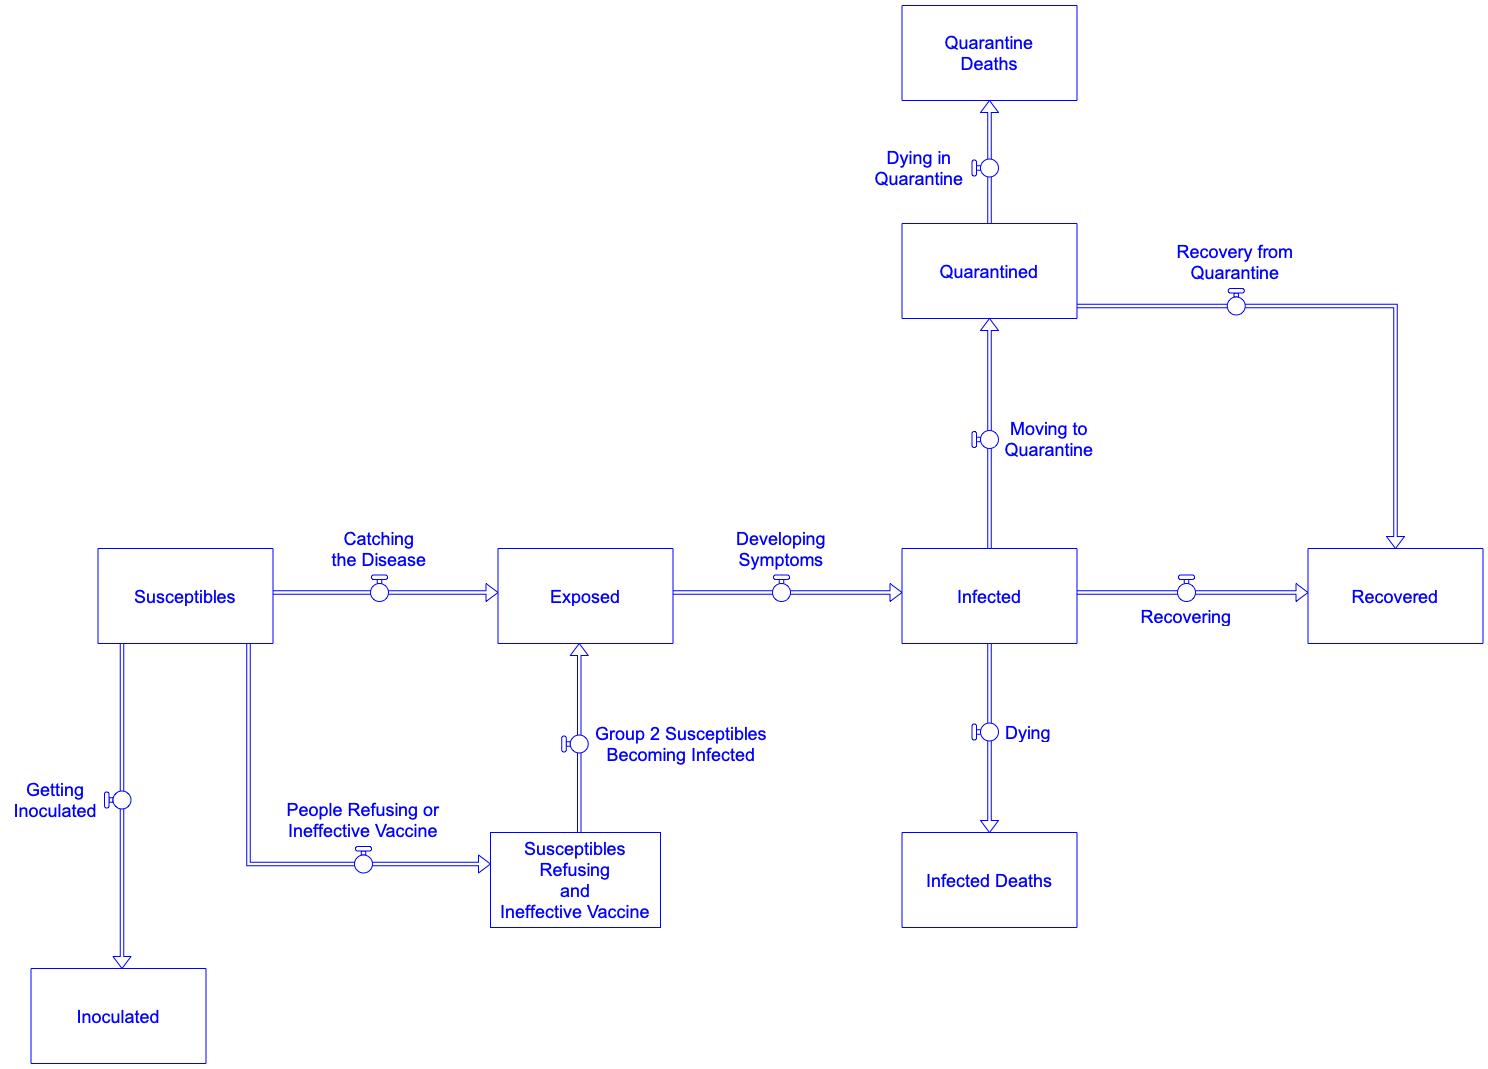
The core stock and flow structure you’ve developed so far is shown in Figure 39 below. We will refer to this diagram to flesh out the next steps in the model building process. In order to keep things readable, this diagram omits many causal links and variables that are in that full model up to this point.
Exercises 6.6 Team Modeling Activity: Stage 2e – Checking the Current Model Agains the Balanced Scorecard
Recall the six variables that were earlier listed as representing the interests of the various stakeholders. These six variables comprise the balanced scorecard that we can use to evaluate policies in light of the stakeholder’s interests and Dr. Constantine’s goals. At this stage of our model building effort, we want to make sure that our model includes information that can be used to construct BOTGs of each of these (or of variables that are closely related to these).
Recall that these balanced scorecard variables were:
- #Cases: The number people exhibiting disease symptoms each day, along with the total cases so far.
- #Deaths: The number of deaths from the disease so far
- #Requiring hospitalization: The number of people requiring hospital care (daily and overall)
- Cost: Total cost of providing health care for disease victims
- #Inoculated: Number of people who have been vaccinated and who are resistant to the disease (if a vaccine is available)
- #Quarantined: Number of people sick people placed in quarantine
Examine Figure 37 and identify which (if any) of the above six balanced scorecard variables are already present in the model and which are not? Fill out this table.
| Balanced Scorecard Variable | Already Present in the Model? (Y/N) | If present, which variable would. you plot on a BOTG to show this (if you need to calculate a variable to plot, show the equation you’d use)? |
| # New cases each day | ||
| # Cases so far (total cases) | ||
| # Deaths each day | ||
| # Deaths so far | ||
| # Requiring hospitalization | ||
| Costs | ||
| # Inoculated | ||
| # Quarantined |
It is clear from the above exercise that we have to add some features to the model to account for the cost of the public health response to an outbreak, as well as features that account for the flow of people into and out of the hospital during the outbreak.
Exercises 6.7 Team Modeling Activity: Stage 2f – Augmenting the model to account for hospitalization
Add to the model a stock and flow structure to account for the number of people needing hospitalization during the outbreak. To do this, keep in mind the following:
- Add a stock called Hospitalized. This will stand for all the people who are in the hospital at any given point in time.
- People can flow into the Hospitalized stock from either the Infected or Quarantined stocks.
- On average, between 10% and 50% of Infected and Quarantined people will need to be taken to the hospital each day. Create two variables called Daily fraction infected who are hospitalized and Daily fraction quarantined who are hospitalized to account for these fractions.. Set each to a default value of 0.20 with a range from 0.1 to 0.5.
- Some fraction of people in the hospital will die.
- Add a stock called Hospital deaths with a flow into it from the Hospitalized stock.
- Because people in the hospital receive better care, the daily fraction of people who die in the hospital will be 50% lower than the overall Daily death fraction from the Infected or Quarantined stocks. Create a new variable called Daily death fraction for hospitalized to represent this daily fraction and make it dependent on the value of the original Daily death fraction.
- Of those in the hospital that do not die, the rest eventually recover (and hence flow into the Recovered stock). Create a variable called Daily fraction hospitalized who recover to account for this fraction that flows into the Recovered stock each day. Set its default value to be 0.17 with a range from 0.1 to 0.3.
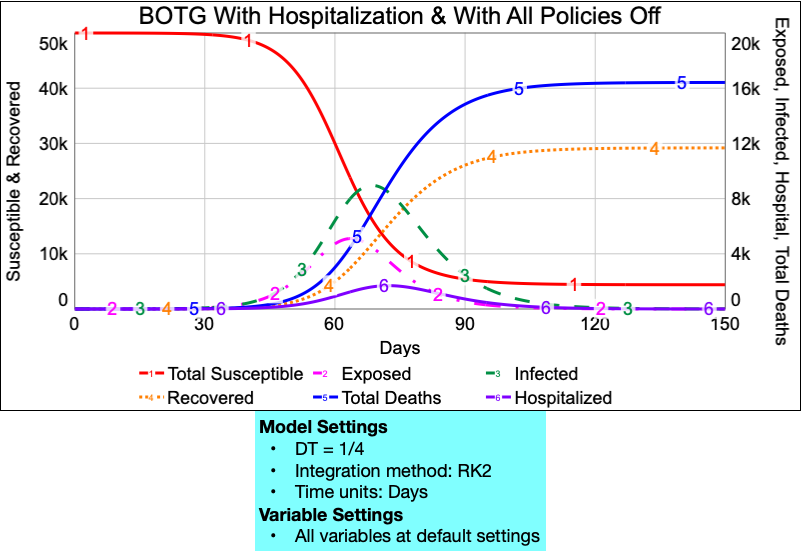
Once you incorporate this structure, the BOTG should match what you see below. IMPORTANT: Note what is plotted on each of the Y-axes, and make sure your model matches this output.
Exercises 6.8: Stage 2g – Augmenting the Model to Account for Total Healthcare Costs
Add to the model a stock and flow structure to account for total healthcare costs from the epidemic. These costs come from the cost of vaccination and the cost of hospitalization.
- On average, each disease victim who enters the hospital will incur costs of $3,500. Create a variable called Per Patient Hospital Cost to account for this. Set this up so that the cost can be adjusted from $2000 to $10,000 in $100 increments.
- Development of a vaccine is estimated to cost $200 million. Create a variable called Vaccine development cost. Allow it to be adjusted between $200 million and $500 million.
- Once a vaccine is developed, each dose is estimated to cost $200. Create a variable called Dosage cost to account for this. between $50 and $300. Set this up so that the cost can be adjusted from $50 to $300 in $10 increments.
- Create two new stocks to accumulate the healthcare costs over the duration of the epidemic.
- The stock Total hospital costs will store the accumulated costs from individuals who are hospitalized. This stock will have a single inflow that adds costs every time someone goes to the hospital
- The stock Total vaccination costs will store the accumulated costs from vaccinating people. This stock will have a single inflow that adds cost every time someone is vaccinated.
- Add a variable called Total healthcare costs to represent the total costs of the epidemic and policies chosen by the user (Total hospital costs + Total vaccination costs + Vaccine development cost). Note that the Vaccine development cost should be added in only if the Inoculation policy switch is ON.
Once you incorporate this structure, the BOTG should match what you see below. IMPORTANT: Note what is plotted on each of the Y-axes, and make sure your model matches this output.
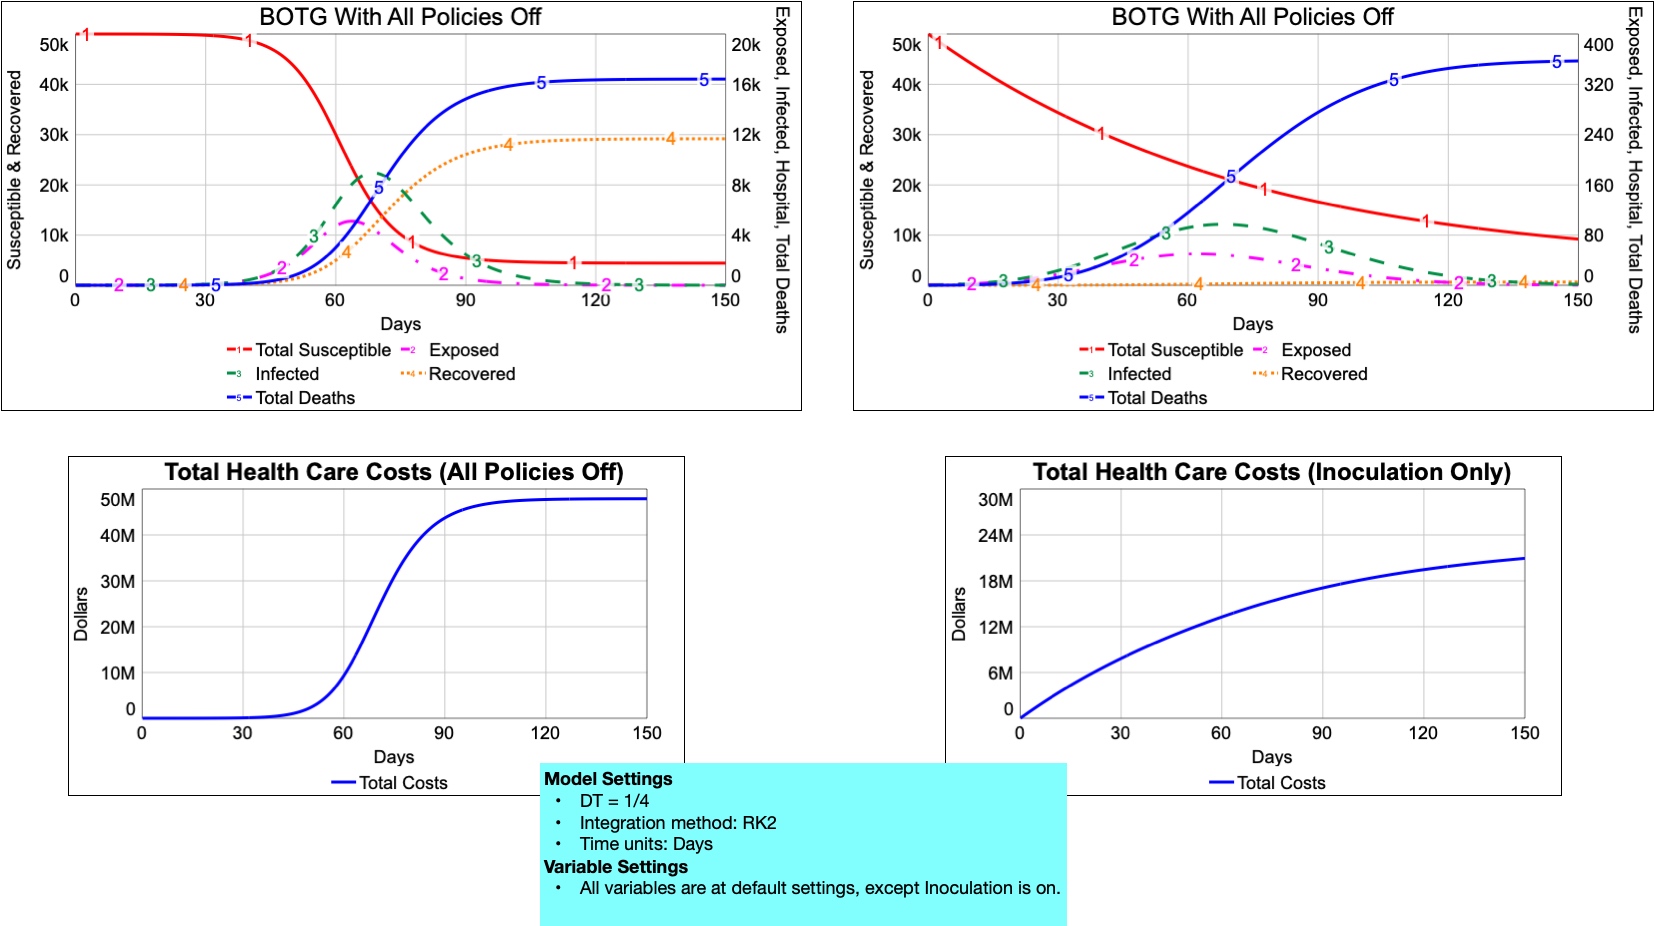
Creating an interface with a balanced scorecard
Now it is time to build an interface that allows your decision maker, Dr. Constantine to explore policy options, and evaluate them using the balanced scorecard. In general, your interface should provide two types of control knobs. One type corresponds to those policies that the decision maker wishes to evaluate. Let’s call these control knobs the policy knobs. By adjusting these, the policymaker can turn certain policies “on” or “off” and can conceivable adjust parameters that are potentially under their control to fine tune those policies.
The other type of control knob are those that represent external conditions or assumptions about the system whose exact values are unknown. Let’s call these external condition knobs. The policy maker wishes to know if the policies they choose are unnecessarily dependent on assumptions or values that are not known with great precision. Policies that meet this requirement are said to be robust with respect to external conditions. For example, consider these two cases:
- Case 1: Policy A gives outstanding results under a particular set of assumptions, but gives terrible results if any of those assumptions are off by even a little bit.
- Case 2: Policy B gives good conditions (but not as good as A under some conditions). In addition, the benefits from this policy (compared to others) are reliable, regardless of the external conditions.
In this situation, Policy B is more robust with respect to the external conditions than is Policy A. Hence, it would clearly be preferred over Policy A.
Exercise 6.9 Team Modeling Activity: Stage 2h – Identifying Policy Knobs and External Condition Knobs for the SEIR Problem
Below is a list of the control knobs (variables that can be adjusted) in the SEIR model that you’ve built. For each knob, place an X to indicate it it is a policy knob or an External condition knob.
| Control Knob from the Model | Is it a Policy Knob? | Or is it an External Condition Knob? |
| Knobs related to the disease | ||
| Infectivity | ||
| Incubation Time | ||
| Daily Death Fraction | ||
| Knobs Related to Social Distancing | ||
| Social Distancing Switch | ||
| Effect of Social Distancing on Daily Contacts | ||
| Baseline Contact Rate | ||
| Deployment Time (to Inoculate Smallville Population) | ||
| Knobs Related to Vaccine Use | ||
| Vaccine Effectiveness | ||
| Proportion Refusing Vaccination | ||
| Inoculation Switch | ||
| Knobs Related to Quarantine | ||
| Proportion Agreeing to Quarantine | ||
| Quarantine Switch | ||
| Quarantine Delay Time | ||
| Knobs Related to Hospitalization | ||
| Daily Fraction Quarantined Who are Hospitalized | ||
| Daily Fraction Infected Who are Hospitalized | ||
| Daily Fraction Hospitalized Who Recover | ||
| Knobs Related to Healthcare Costs | ||
| Vaccine Development Costs | ||
| Dosage Cost | ||
It’s now time to create a user interface for your client, Dr. Constantine. This interface should allow Dr. Constantine to do the following:
- Try out the following three policies (or combinations of them) for responding to an H5N1 outbreak in Smallville. This will be done by providing policy control knobs for Dr. Constantine to adjust.
-
- Inoculation: Develop a vaccine for H5N1 (estimated cost: $200 million) and use it to inoculate the population. You will provide the following policy control knobs:
- Inoculation switch (to turn the policy on or off)
- Deployment time (can be shorter or longer by subtracting or adding resources to the team responsible for inoculating the citizens)
- Vaccine effectiveness (can be raised through a more expensive vaccine development program)
- Quarantine: Place in quarantine those individuals showing disease symptoms. The quarantine would last until they recover (or die). The policy control knobs for this are:
- Quarantine switch (to turn the policy on or off)
- Quarantine delay time (can be shorter or longer, depending on how many resources are applied)
- Social distancing: Promote social distancing (self-quarantine) by providing daily updates on news media and by distributing to the public resources such as face masks and antiseptic hand cleansers. Here are the policy control knobs:
- Social distancing switch (to turn the policy on or off)
- Effect of Total deaths on daily contacts. This is a graphical function whose shape can be affected by changing how aggressive are the media campaigns to update the public and by changing the resources dedicated to distributing tools like face masks and disinfectant cleaners to avert spread of the disease. More aggressive efforts and more resources will lead to a steeper curve in this graphical function.
- Inoculation: Develop a vaccine for H5N1 (estimated cost: $200 million) and use it to inoculate the population. You will provide the following policy control knobs:
- Evaluate each policy (or combinations of those policies) against a balanced scorecard. From an earlier activity we learned that the balanced scorecard should be comprised of the following collection of BOTGs. In each case, we describe the relevance of the BOTG, the stakeholders who are interested in it, and what they would like to see (i.e. their “hopes” for this BOTG).
-
- #H5N1 cases each day: BOTG of the total Exposed + Infected stocks. This shows how fast the disease is spreading and how long an epidemic might last. A rapidly-spreading disease is much more difficult to handle than a slower-spreading epidemic.
- Total #H5N1 cases so far: BOTG of the sum of Exposed, Infected, Quarantined, Hospitalized, Recovered, and Total Deaths. This is an overall measure of how severe the epidemic was. At the end of the day, the more people who got the disease, the worse things are for the town. Dr. Constantine would like to keep this value as low as possible.
- #Deaths: BOTG of the Total Deaths. Dr. Constantine and all the stakeholders are concerned about this and want to keep deaths to a minimum.
- #Requiring hospitalization: BOTG of the Hospitalized stock. Recall that the Smallville Director of public health is worried that the two hospitals in town may not have the capacity to handle the number of patients during a disease outbreak. The two hospitals have 520 beds between them. Hence, if the #requiring hospitalization exceeds 520, there will be a problem.
- Cost: BOTG of Total Healthcare Cost. The Blue Diamond/Blue Square health insurance company is concerned about high healthcare costs from an epidemic, and would support policies that keep these costs as low as possible.
- #Inoculated: BOTG of the Inoculated stock. The Medicine No More citizen group is opposed to vaccinations in general. The higher this BOTG goes, the more concerned they will be.
- #Quarantined: BOTG of the Quarantined stock. The citizens of Smallville are concerned that a heavy-handed quarantine policy will infringe on their freedom of movement.
-
- Test how robust her best policies are against changes in those conditions or assumptions that we don’t know for certain. This will be done by providing several external condition knobs that Dr. Constantine can adjust and see how the policies do under differing conditions. For the purposes of this case study, we will provide the following external condition knobs on the interface.
- Infectivity. How will the policies do if the infectivity of the H5N1 virus is higher or lower? Use a default value of 0.05, but allow this to be adjusted from 0.01 to 0.9
- Baseline Contact Rate. What if this is higher or lower? How would that impact the relative effectiveness of the policies? Use a default of 5 contacts per person each day, but allow it to be adjusted between 1 and 10 contacts.
- Daily Death Fraction. What if the disease were more deadly? Less deadly? Use a default of 0.05, but allow it to be adjusted between 0.02 and 0.2
- Incubation Time. What if it takes shorter or longer for someone to begin to show symptoms after they have contracted the disease? Use a default of 3 days and allow this to be adjusted between 2 and 12 days.
- Daily Fraction Quarantined Who are Hospitalized. Use a default of 0.05 and allow it to be adjusted between 0.1 and 0.5.
- Daily Fraction Infected Who are Hospitalized. Use a default of 0.2 and allow it to be adjusted between 0.1 and 0.5.
- Dosage Cost. Use a default of $200, but allow to vary between $50 and $300.
- Per Patient Hospital Cost. Use a default of $3,500 and allow to vary between $1,500 and $10,000.
Exercises 6.10: Stage 2i – Create a User Interface with a Balanced Scorecard
Build a user interface for Dr. Constantine. Your interface should be organized as follows.
- Main menu
- A BOTG showing each of the S-E-I-R stocks (all on one graph)
- BOTG showing the total deaths and total costs of the epidemic (use separate Y-axes)
- Run and Stella Live/Reset buttons
- Policy control knobs, organized neatly according to the policy
- Buttons navigating to the balanced scorecard BOTGs. These should be clearly labeled (do not restore devices, etc.)
- Button navigating to a separate page with all the external control knobs (do not restore devices, etc.)
- Page showing the external condition knobs.
- Include the same graphs as on the main page
- Main menu button (do not restore devices, etc.)
- Buttons to all of the balanced scorecard graphs (do not restore devices, etc.)
- Each page showing one of the balanced scorecard BOTGs
- BOTG uses most of the space on the page
- Clear titles, axis labels (especially y-axes)
- BOTG should be a COMPARATIVE graph (so you can compare separate runs)
- Main menu button (do not restore devices, etc.)
- Button to navigate to the page containing external condition knobs. (do not restore devices, etc.)
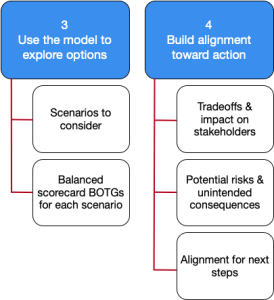 5. Stages 3 and 4 Exploring Options and Building Alignment
Exercises 6.11: Team Modeling Activity… Stages 3 and 4 – Evaluating Policies and Making Recommendations
Now use your model and interface to explore the three policies that Dr. Constantine is considering. Your task is to find a set of policies that will help Dr. Constantine achieve her goal. That goal is summarized in the following problem statement (created in cooperation with Dr. Constantine):
How can we apply some combination of inoculation, quarantine, and social distancing that will minimize the health impact on the community (in terms of deaths and the number of people who catch the disease)? Can we do so in a way that most effectiely uses our financial resources and minimizes the concerns of the stakeholders?
One approach is to do the following.
- Begin by individually examining each of the three policies.
- For each policy, find the “optimal” conditions (as determined by the balanced scorecard).
- Then vary the external control knobs to see if things change much or how they change.
- Repeat this for all three policies.
- Finish by trying out combinations of policies (vaccination + social distancing; social distancing + quarantine, etc) to see if there is a combination that does even better than any individual policy, when considering the balanced scorecard.
- Fill out the table like the one shown here.
- Identify the conditions you recommend as the best option, and be prepared to defend them. Make sure you can speak to how your choices might be viewed by each of the stakeholders.
The worksheet below corresponds with the different BOTGs you have created. The critical information is in those BOTGs, reflecting how behavior has changed over time. Use Table 1 to track whether the policy has improved, stayed the same, or worsened based on the key variables you identified.
| Policy | Best Settings for Policy Knobs | Impact on Balanced Scorecard BOTGs | ||||||
| Daily H5N1 Cases | Total H5N1 Cases | Deaths | Number Requiring Hospitalization | Total Healthcare Cost | Number Inoculated | Numbered Quarantined | ||
| Only Inoculation | ||||||||
| Only Quarantine | ||||||||
| Only Social Distancing | ||||||||
| Combination of Policies | ||||||||
- . Morbidity: The rate at which a disease occurs in a population (i.e., the fraction of people that get the disease). Mortality: The fraction of disease victims that die from the disease. ↵
- World Health Organization. WHO COVID-19 Dashboard. [Web Page] 2024 [cited 2024 04/18/2024]; Data on global deaths from COVID-19]. Available from: https://data.who.int/dashboards/covid19/deaths. ↵
- World Health Organization, FAQ’s: H5N1 Influenza, http://www.who.int/influenza/human_animal_interface/avian_influenza/h5n1_research/faqs/en/ ↵
- World Health Organization, Influenza (Avian and other zoonotic), http://www.who.int/mediacentre/factsheets/avian_influenza/en/ ↵
- World Health Organization (2007). Clinical management of human infection with avian influenza A(H5N1) virus, http://www.who.int/influenza/resources/documents/ClinicalManagement07.pdf ↵
- A disease is infectious when it can spread from one person (or animal) to another through some form of contact. ↵


Feedback/Errata